Designing Trace Sampling Strategies for Production GenAI: Keeping Observability Useful Without Exploding Cost or Exposing Sensitive Data
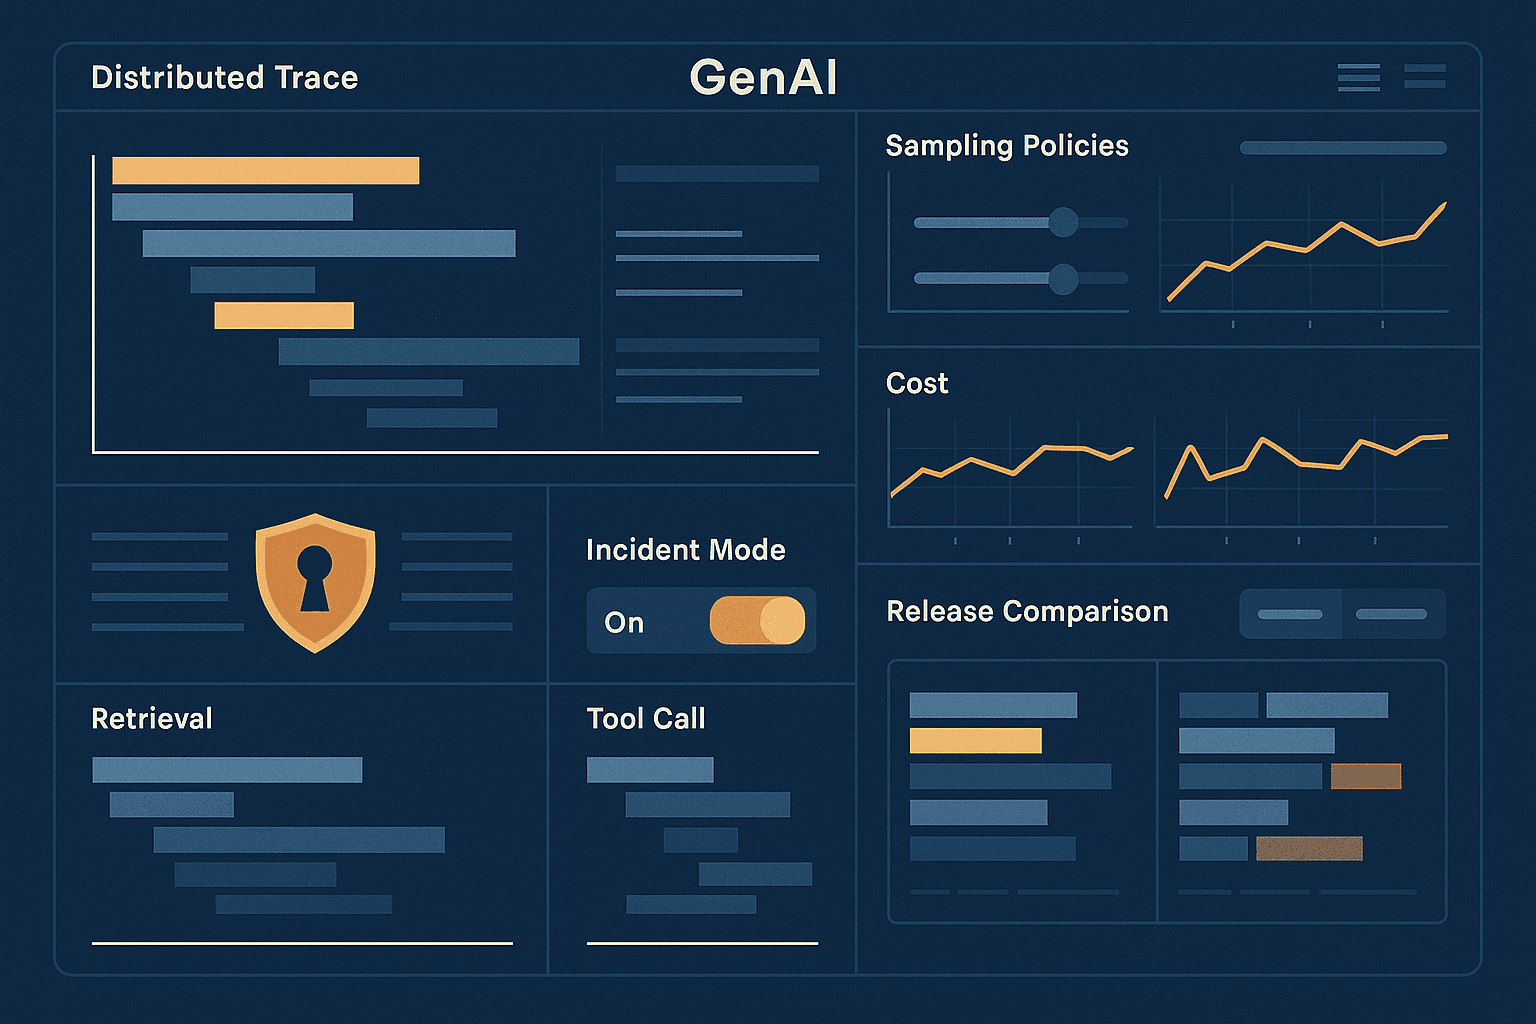
A team ships a customer-support copilot that looks healthy on the surface. Median latency is acceptable. Token spend is roughly in line with expectations. Error rates are low enough to stay out of the weekly incident review. But support agents keep filing complaints: “It cites the wrong refund policy for enterprise accounts.” “It loops through the CRM and billing tools three times before answering.” “It refuses safe requests in German but not in English.” “It got worse after last Thursday’s prompt update.”
The team opens their observability stack and immediately hits the usual wall. They sampled too little of the interesting traffic and too much of the boring traffic. They logged some prompts but not retrieval payloads. They have token counts for all requests but full traces for only a random slice that misses the failures people actually care about. Tool spans are there, but payloads are redacted so aggressively that no one can tell whether the agent called the wrong tool, passed the wrong arguments, or got a malformed response. Worse, legal now wants to know whether any stored traces contain PII from customer emails.
This is where many GenAI teams discover that traditional observability defaults do not carry over cleanly. In a CRUD service, you can often get away with generic distributed tracing and low-rate random sampling because failures are binary and reproducible. In GenAI systems, the expensive part is often the payload, not just the span metadata. The most useful debugging artifacts are also the most sensitive: prompts, retrieved chunks, tool inputs, tool outputs, model completions, classifier decisions, and user-provided content. Quality failures rarely line up neatly with HTTP 500s. The request “succeeds” from infrastructure’s perspective while quietly failing the user.
So the problem is not just “how much tracing can we afford?” It is “what should we capture, for which requests, at which fidelity, for how long, and under what privacy policy, so we can still debug quality, track regressions, and make release decisions?”
That is the central design task for production GenAI observability: preserving enough signal to operate the system without turning your tracing platform into a budget fire or a privacy incident.
The right answer is not to log everything, and it is not to sample uniformly at 1%. The right answer is a layered sampling strategy that treats GenAI traces as a mix of telemetry classes with different utility, sensitivity, and cost profiles. You keep cheap aggregate metrics for everything. You keep lightweight trace skeletons for most traffic. You reserve full-fidelity capture for the requests most likely to teach you something: failures, risky workflows, new releases, unusual tenants, expensive traces, policy-triggered cases, and representative examples for ongoing evaluation.
The pattern shows up across nearly every serious deployment.
First, random head sampling under-captures the rare traces you care about most. A hallucinated financial answer may happen in only 0.3% of requests. A prompt-injection attempt may be 0.05% of traffic. An infinite tool loop may affect just one tenant after a feature flag change. If you sample 1% uniformly at ingress, your chances of preserving enough of those traces to diagnose root cause are poor.
Second, full payload logging becomes financially and operationally absurd faster than teams expect. A trace that includes system prompt, conversation history, retrieved passages, reranker metadata, tool arguments, tool results, safety classifier outputs, and final completion can be orders of magnitude larger than a conventional backend trace. Storing that for even 10% of production traffic can swamp the cost of your actual application logs. It also slows indexing and makes searches painful.
Third, payload sensitivity is not uniform. Token counts, model name, span timing, and tool names are usually low sensitivity. Raw customer emails, account notes, medical history, retrieved documents, and completion text can be highly sensitive. Treating all fields alike either creates privacy exposure or destroys debugging utility.
Fourth, the useful notion of “failure” in GenAI is not just a server error. It includes low-confidence retrieval, grounding mismatches, policy intervention, user abandonment, repeated reformulations, low-rater feedback, expensive retries, unusual refusal patterns, poor citation quality, and downstream business misses like lower resolution rates. If your sampling policy only keys off transport-layer errors, you will miss the most damaging incidents.
The naive approach usually fails in one of three ways.
The first naive approach is blanket logging. Teams log everything because they know GenAI behavior is hard to reproduce. This works for a week, then cost spikes, compliance gets nervous, and engineers start manually disabling fields. The result is inconsistent telemetry and emergency retention cuts that destroy historical comparability.
The second naive approach is generic APM sampling. Teams rely on whatever their tracing vendor does by default: perhaps 1% head sampling, maybe biased toward slow traces. This captures infrastructure pathologies but does very little for semantic quality failures. You get waterfall charts but not the right examples.
The third naive approach is ad hoc debug toggles. Engineers add feature flags like LOG_FULL_PROMPTS_FOR_TENANT_X=true or temporarily raise sample rates during incidents. That is sometimes necessary, but without a coherent framework you end up with accidental over-collection, inconsistent payload shapes, and no principled way to compare release A to release B.
A better approach is to design observability around four telemetry tiers and two orthogonal policy layers: a fidelity layer and a privacy layer.
The fidelity layer answers: how much of this trace do we keep?
A practical four-tier model looks like this:
- Metrics-only
- Always-on counters, histograms, gauges, and cost metrics.
- Examples: request count, latency by stage, prompt tokens, completion tokens, tool-call count, retrieval hit rate, safety-trigger count, cost per request, user feedback score, cache hit rate.
- Lowest storage cost, lowest privacy risk.
- Skeleton traces
- Span graph and standard attributes, but little or no raw payload.
- Examples: request ID, tenant, workflow, model, model version, prompt template version, tool names, retrieval index ID, chunk count, timings, token totals, classifier labels, finish reason.
- Useful for debugging latency/cost/topology issues and joining metrics to richer captures.
- Partial payload traces
- Payloads summarized, hashed, truncated, classified, or transformed.
- Examples: prompt template ID plus variable names but not full values; retrieval doc IDs and scores but not contents; tool argument schema validation result; output toxicity/groundedness scores; first 200 chars of completion; prompt/output embeddings for clustering; PII detector labels.
- High utility for quality investigation with lower privacy exposure.
- Full-fidelity traces
- Raw prompts, retrieved text, tool inputs/outputs, full model completions, safety reasoning artifacts where permitted.
- Reserved for a tightly controlled subset of traffic.
- Highest debugging value, highest privacy and cost burden.
The privacy layer answers: which fields are allowed to exist at all, in which environment, for which tenant, under what retention, and in what transformed form?
This separation matters because teams often confuse sampling with redaction. They are different controls. Sampling decides whether a trace is retained. Privacy policy decides what the trace may contain. You want both.
A production architecture that works well usually has six pieces.
First, instrumentation at the application layer, not just the HTTP or SDK layer. You need spans for prompt assembly, retrieval, reranking, each model invocation, each tool call, guardrail checks, post-processing, and user feedback events. If you do not instrument these semantic steps, no sampling policy can save you.
Second, a trace envelope emitted for every request with low-cost metadata. This is your universal skeleton. It should include correlation IDs, tenant/workflow identifiers, release version, model and prompt versions, timing, token and cost counters, tool sequence, retrieval summary stats, safety labels, and final status. This envelope should be cheap enough to keep for 100% of traffic.
Third, a policy engine that decides per trace and per span whether to store payloads, summaries, or nothing. The decision should consider head signals available at request start, in-flight signals gathered during execution, and tail signals known only after completion.
Fourth, a secure payload processor that can redact, classify, hash, tokenize, truncate, or encrypt sensitive fields before they reach your storage backend. Do not make your tracing vendor the first place that raw payloads land if you can avoid it.
Fifth, a trace store split by sensitivity and retention class. Metadata may live for 30–90 days. Partial payload traces may live 7–30 days. Full-fidelity traces might live 24 hours, 7 days, or not at all for certain tenants. Some teams route highly sensitive payload captures into a separate encrypted store with stricter access controls and audit logging.
Sixth, an evaluation and analytics layer that treats sampled traces as examples for quality measurement, not just debugging artifacts. This is where teams extract representative cases, build regression dashboards, compare releases, and connect trace characteristics to business outcomes.
The most important design choice is combining head sampling and tail sampling intelligently.
Head sampling makes decisions near request ingress, before work is done. It is cheap and easy. You know tenant, workflow, endpoint, user segment, release variant, maybe geography, maybe whether the tenant is on an allowlist or denylist for payload retention. Head sampling is ideal for guaranteeing representation: for example, “capture 5% skeleton traces for all tenants, 20% partial traces for a new workflow, and 100% full traces in staging.”
But head sampling cannot see what actually happened. It does not know whether retrieval failed, whether the answer was low quality, whether tool loops occurred, whether token spend blew up, or whether a guardrail tripped.
Tail sampling makes decisions after or near the end of the trace, using observed outcomes. It can preserve the traces you care about most: slow outliers, policy interventions, low grounding scores, repeated tool retries, expensive requests, or low user feedback. Tail sampling is the only sane way to capture rare semantic failures at high rates without storing everything.
In production GenAI, you almost always want both.
A workable pattern is:
- Use head sampling to guarantee baseline representation by tenant, workflow, release, and traffic slice.
- Use tail sampling to override and keep traces with failure or risk signals.
- Allow incident-mode policies to temporarily raise rates for selected cohorts.
- Separate the decision for trace retention from the decision for payload retention.
Here is what that can look like concretely.
For 100% of traffic, keep metrics and a skeleton trace. This gives you broad visibility into latency, token usage, costs, and execution structure.
For maybe 2–10% of traffic, selected via stratified head sampling, keep partial payload traces. Stratify by tenant tier, workflow type, model version, and release cohort. This gives you representative examples for routine evaluation and regression monitoring.
For traces matching tail conditions, keep full or near-full payloads regardless of the baseline sample. Tail conditions might include:
- User thumbs-down or explicit complaint
- Safety or policy classifier trigger
- Retrieval confidence below threshold
- Citation/grounding score below threshold
- More than N tool calls or repeated tool call pattern
- Cost above p95 or p99 for that workflow
- Latency above p95 or timeout/retry behavior
- Finish reason indicating truncation or context overflow
- Parser/structured-output validation failure
- Session abandonment after answer
- Canary release traffic with poor relative performance
For especially sensitive workflows, do the same but keep partial payloads instead of full payloads unless the tenant and policy allow more.
This is where GenAI-specific observability diverges from normal tracing. In most systems, “error=true” is enough to justify retention. In GenAI, you need a richer library of failure predicates.
A practical failure-aware predicate set often includes five families.
- System failures
- Exceptions, timeouts, transport errors, circuit breaker trips, bad gateway responses.
- These are conventional and still matter.
- Cost and latency failures
- Token counts above learned bounds for the workflow.
- Unexpected fan-out to multiple model calls.
- Repeated tool retries.
- Long-tail retrieval or reranker latency.
- Structural quality failures
- Invalid JSON or schema mismatch.
- Missing citation when required.
- Hallucination detector hit.
- Answer unsupported by retrieved passages.
- Empty retrieval result followed by high-confidence answer.
- Safety and policy failures
- Prompt injection classifier fired.
- Sensitive-topic classifier fired.
- Refusal triggered, especially inconsistent refusals by locale or tenant.
- PII leakage detector flagged output.
- Product-outcome failures
- User thumbs-down.
- Reformulation within 2 minutes.
- Escalation to human.
- Resolution not achieved.
- Purchase or task completion dropped after release.
The trick is not to hard-code every threshold forever. Start with coarse heuristics, then refine them using observed distributions. For example, “capture if tool_calls > 3” might be a decent first pass. Later you may replace it with “capture if tool_calls > p95 for tenant/workflow/model combination” or “capture if tool-call sequence edit distance from normal paths exceeds threshold.”
Tenant and workflow stratification is another place where naive random sampling falls down.
Suppose one enterprise tenant accounts for 40% of traffic. A flat 5% sample will mostly tell you about that tenant. Smaller but strategically important customers may disappear from the sample, along with niche workflows like contract redlining or multilingual compliance QA. Yet those are often the workflows where quality failures have the highest business risk.
Instead, define strata explicitly. Typical dimensions are:
- Tenant or tenant tier
- Workflow or use case
- Model/provider/version
- Release cohort or feature flag variant
- Geography/language
- Data sensitivity class
- Traffic source: interactive, batch, background, API
Then allocate sample budgets per stratum rather than globally. For example:
- Enterprise support assistant: 5% partial payload, 100% failure tail capture
- Internal employee copilot: 2% partial payload, 50% failure tail capture
- Financial-advice workflow: 10% partial payload, 100% policy-trigger capture, full payload only in synthetic or specially approved tenant slices
- New feature canary: 20% partial payload for the first week
- Long-tail languages: minimum 50 traces/day regardless of traffic volume
This gives you representativeness where it matters. It also makes release comparisons much more trustworthy because both baseline and treatment arms can have aligned sampling guarantees.
Now to the most sensitive topic: payload policy.
If you want observability that survives contact with privacy, security, and legal review, you need field-level rules instead of blanket instincts like “never store prompts” or “store only encrypted payloads.” Both are too blunt.
Build a data-classification matrix for each payload type:
- System prompt
- User prompt
- Conversation history
- Retrieved chunk text
- Retrieval metadata
- Tool arguments
- Tool results
- Safety classifier inputs/outputs
- Model completion
- Human feedback text
For each field, define:
- Allowed environments: dev, staging, prod
- Allowed retention classes
- Default transform: none, truncate, mask, hash, tokenize, summarize, encrypt
- Access roles
- Export restrictions
- Tenant overrides
Examples of sane defaults:
- Store full system prompt and prompt template version because these are usually owned by you and critical for debugging.
- Store user prompt only after PII scrubbing, truncation, or approval by tenant policy.
- Store retrieval chunk IDs, source URIs, ranks, and scores broadly; store raw chunk text only for approved collections or short retention.
- Store tool name, latency, schema validation result, and response code always; store tool arguments/results after field-level masking. For CRM tools, maybe account_id is tokenized and free-text notes are dropped or summarized.
- Store full final completion only for sampled traces under approved sensitivity classes; otherwise store summary features such as refusal label, citation count, JSON validation result, toxicity score, and first N characters after redaction.
Do not underestimate how far transformed payloads can take you. A partial trace containing prompt template ID, filled slot names, retrieval document IDs and scores, tool sequence, argument validation errors, output schema validity, safety labels, and user feedback is often enough to identify the problem class without retaining every raw byte.
For some teams, a useful compromise is “content-derived features over content storage.” Instead of keeping raw output, you keep:
- Embedding or locality-sensitive hash for clustering similar failures
- Language ID
- Detected entities by category, not value
- Output length and structure stats
- Grounding or citation score
- Policy labels
- Classifier confidence
That gives you trend analysis and regression detection with much lower exposure.
Adaptive sampling during incidents deserves special treatment because it is where many privacy and cost mistakes happen.
When something breaks in production, the right response is not “turn on full logging for everyone.” The right response is controlled escalation.
Design incident modes ahead of time. For example:
Mode 0: Normal
- Baseline stratified head sampling
- Tail capture for failures
- Standard retention
Mode 1: Elevated debug for scoped cohort
- Increase partial payload sample rate for selected tenant/workflow/release combinations
- Preserve full traces for tail-failed requests in those cohorts
- Short retention, limited access, incident ticket linkage
Mode 2: High-intensity capture for approved incident
- Temporary full-fidelity capture for a tiny targeted cohort or synthetic replay traffic
- Automatic expiry after 24–72 hours
- Explicit approval and audit trail
This matters because incident response is exactly when engineers are tempted to bypass guardrails. If your platform makes the safe thing easy, you reduce the chance of ad hoc over-collection.
Connecting sampled traces to quality regressions is where the observability strategy starts paying back beyond debugging.
The common failure mode is that teams collect traces and metrics separately, but sampled examples never inform release decisions. They end up with a lot of dashboards and not much operational learning.
Instead, treat sampled traces as a continuously refreshed evaluation corpus. Every sampled trace should carry enough labels and join keys to support offline and online analysis:
- Release version or feature flag assignment
- Prompt version
- Model/provider version
- Retrieval/index version
- Tool versions
- Tenant/workflow stratum
- Outcome signals like thumbs up/down, reformulation, escalation, resolution, conversion
Then build release comparisons on sampled cohorts with matched strata. Questions you should be able to answer weekly include:
- Did prompt v43 reduce policy-triggered refusals in German support flows?
- Did model provider B increase cost per resolved case despite lower median latency?
- Did the new retriever improve grounding score for legal documents while harming answer completeness?
- Are tool retries concentrated in one tenant after a CRM schema change?
This is also where your eval program and your observability program should share infrastructure. Online traces expose what users really do. Curated offline evals give deeper labels. The best teams route sampled production traces into an eval pipeline where a subset gets human review or LLM-judge scoring under strict policy. Over time, those labels improve the tail-sampling predicates themselves.
For example, if human review shows that low retrieval-score variance plus no citations strongly predicts hallucination in one workflow, you can add a capture rule for that pattern. If traces with repeated self-correction and final thumbs-down predict poor task completion, that becomes another sampling feature.
Implementation details matter here, because a good concept can still collapse under throughput and vendor limitations.
On the instrumentation side, use OpenTelemetry or equivalent for span structure, but extend it with GenAI-specific semantic attributes. You want conventions for:
genai.workflow.namegenai.tenant.idgenai.release.versiongenai.prompt.template_idgenai.prompt.versiongenai.model.providergenai.model.namegenai.model.parametersgenai.tokens.promptgenai.tokens.completiongenai.cost.usdgenai.retrieval.indexgenai.retrieval.kgenai.retrieval.top_scoregenai.tool.namegenai.tool.retry_countgenai.output.schema_validgenai.safety.labelsgenai.user_feedback
For payload fields, do not shove everything into generic log blobs. Use typed attachments or sidecar records with explicit sensitivity labels. That makes policy enforcement and deletion much easier.
A simple policy engine can score each trace on three axes:
- Debug value
- Risk/sensitivity
- Budget impact
Then map score bands to retention classes. Pseudocode might look like this conceptually:
- Start with base sample rate from stratum table.
- Add debug-value points for canary release, rare language, high-value tenant, new workflow.
- Add keep overrides for failures: timeout, thumbs-down, grounding fail, parser fail, policy trigger, p99 cost.
- Subtract or cap payload fidelity for high sensitivity class unless approved.
- If monthly budget burn is above threshold, reduce noncritical partial-payload rates but never disable critical tail capture.
That last point is important. Cost control should degrade gracefully. If budgets tighten, cut broad representative payload sampling before you cut failure capture or universal skeletons.
Model and tool comparisons also shape sampling design.
Different model providers expose different observability affordances and risks. Some APIs return token accounting and structured log probabilities; others return little. Some allow prompt retention opt-out; others may use data for abuse monitoring with separate retention semantics. Some tool-calling APIs give clean structured arguments; others hide tool rationale inside generated text. Your sampling policy should normalize what you can, but accept that cross-provider comparisons may need provider-specific spans and feature extraction.
For retrieval systems, raw chunk storage is often the biggest payload multiplier after conversation history. A common optimization is to store chunk IDs, source metadata, scores, and a content hash for most traces, then lazily resolve raw text from the document store only for approved investigations. That dramatically reduces trace size and duplication. It also improves deletion semantics because document content remains in one controlled system of record.
For tool spans, the main debugging need is usually not the full payload but whether the right tool was selected, whether arguments were well formed, how many retries occurred, and whether the response shape matched expectations. You can often store argument schemas, field presence indicators, hashed IDs, and validation outcomes instead of raw bodies. Reserve raw tool payload capture for small allowlisted subsets.
Cost and latency tradeoffs should be explicit, not guessed at.
A useful budgeting model splits observability cost into:
- Ingest and storage for metrics
- Ingest and indexing for trace metadata
- Blob/object storage for payload attachments
- Query and dashboarding costs
- Human review costs for evaluation
Then estimate marginal cost per additional 1% sample rate for each fidelity tier. You will usually find that:
- Metrics for 100% traffic are cheap relative to everything else.
- Skeleton traces at 100% may be affordable if attributes are disciplined.
- Partial payload sampling is where most teams should spend their steady-state budget.
- Full-fidelity payloads should be tiny in volume but high in yield.
Latency overhead matters too. Synchronous payload processing can hurt tail latency if you are doing heavy redaction or classification inline. The usual pattern is to emit a lightweight event synchronously, then perform payload transformation asynchronously via a secure sidecar or ingestion pipeline. Only be careful that the asynchronous path still has enough context to decide retention and correctly associate with the trace.
One subtle but important implementation choice is whether to sample traces independently or sessions/conversations as a unit. For chat systems, sampling isolated turns can destroy context. If turn 8 is bad, you often need turns 1–7. A common compromise is session-aware sampling:
- Always keep skeletons for all turns.
- If any turn in a session matches a tail-failure predicate, upgrade retention for the surrounding N turns or the whole session under the applicable privacy policy.
- For representative eval sampling, sample complete sessions rather than individual turns for a subset of chat workflows.
Another subtlety is reproducibility. If you store too little, you cannot replay. If you store too much, you create risk. The middle path is deterministic reconstruction where possible: keep prompt template/version, model parameters, retrieval IDs, tool versions, and content hashes. That may let you approximately replay many traces later without storing every raw field. It will not be perfect if underlying documents or models changed, but it often gets you close enough for debugging classes of issues.
What does a mature sampling policy look like in practice? Something like this:
- 100% metrics and skeleton traces for all requests.
- 5% stratified partial payload sampling across stable workflows, with minimum daily quotas for low-volume strata.
- 20% partial payload sampling for canary releases and new workflows for the first 7–14 days.
- 100% tail capture of traces with system failures, parser failures, policy triggers, p99 cost/latency, negative feedback, grounding failures, or anomalous tool loops.
- Full payload retention only for approved sensitivity classes and only for tail-captured failures or specifically allowlisted cohorts.
- Retrieval content stored as IDs and hashes by default; raw passages fetched on demand from source systems for approved investigations.
- Tool payloads masked by field policy, with raw capture limited to specific tools and short retention.
- Incident modes that temporarily raise rates for scoped cohorts with automatic expiry.
- Weekly pipeline that converts sampled traces into eval candidates and release-comparison dashboards.
The final piece is governance, because even a technically elegant sampling strategy fails without operating discipline.
Assign clear owners for:
- Sampling policy definitions
- Privacy transforms and field classifications
- Retention schedules
- Incident-mode approvals
- Access control and audit review
- Eval pipeline quality and label definitions
Review the policy on a regular cadence. The right sample rates in month one will not be right in month six. Workflows stabilize. New tenants arrive. Budgets change. Regulatory obligations tighten. Models and tool APIs evolve. You need to treat sampling as a product surface, not a one-time observability setting.
If you are early, keep the rollout simple:
- Instrument semantic spans and universal skeleton traces.
- Define payload classes and privacy transforms.
- Add stratified representative sampling for partial payloads.
- Add tail capture for obvious failures.
- Link sampled traces to feedback and release metadata.
- Iterate on predicates using review data.
If you are already operating at scale, the biggest unlock is usually moving from one-dimensional random sampling to policy-driven sampling keyed to risk, outcomes, and strata. That is where teams stop drowning in low-value traces and start preserving the examples that actually explain regressions.
The takeaway is straightforward. In production GenAI, useful observability is not about capturing more traces. It is about capturing the right traces at the right fidelity under the right privacy policy.
Keep cheap telemetry for everything. Keep structural traces broadly. Sample representative payloads by tenant, workflow, and release. Override with tail capture for failures, risk signals, and anomalies that matter to users and the business. Transform or split sensitive payloads so privacy policy is enforced by design, not by hope. And make sampled traces feed your eval and release process, not just your incident retros.
If you do that well, observability stops being a storage problem and becomes an operating advantage. You can explain quality regressions faster, control spend with intention, satisfy privacy constraints without going blind, and make release decisions using evidence from real production behavior rather than guesswork.