Decision Logs for Production GenAI: Recording Why Retrieval, Routing, and Agent Actions Happened
Most teams discover they need decision logs after a bad week.
The incident usually does not begin with a model crash. It begins with a believable answer that should never have been produced, or a customer escalation that reads something like: “Your assistant ignored the latest policy and told our rep to refund a non-refundable charge.” Then the reconstruction begins.
Someone pulls the raw prompt and completion. Another person checks the vector database and confirms the correct document existed. A third person notices the retrieval service returned it, but the reranker pushed it to rank six. Someone else discovers the orchestration layer had a “top-3 only” context budget because latency had been tightened during an unrelated incident. Then legal asks why the system did not trigger the high-risk escalation rule for refund exceptions. Security asks whether sensitive user attributes were sent to the model. Product asks how often this happened before anyone noticed.
At this point, many GenAI teams realize they have logs, but not decision logs. They have API request logs, application logs, and maybe prompt traces. But they do not have a structured record of why the system chose to answer, abstain, route to a more expensive model, call a tool, skip a tool, block content, or invoke a guardrail. They cannot replay the chain of decisions across retrieval, ranking, routing, prompt construction, model invocation, and tool execution. They can see what happened in fragments, but not why it happened as a system.
That gap matters more in GenAI than in conventional software because production behavior is usually the result of multiple probabilistic subsystems interacting under policy constraints. The final answer is only the surface artifact. The real system behavior emerges from intermediate choices: which query rewrite variant was used, which retriever won, which score thresholds fired, which policy flags were present, which model was selected, which tools were eligible, which guardrails were evaluated, and which evidence made it into the prompt.
If you cannot reconstruct those decisions, you cannot reliably debug incidents, satisfy audits, improve performance offline, or build trust with stakeholders who need more than “the model did it.”
The pattern is consistent across production systems.
First, the team starts with standard observability: HTTP logs, latency metrics, maybe traces for service calls. Then GenAI-specific complexity accumulates. A user question can be rewritten. The rewritten query can hit multiple retrieval systems. Retrieved items can be deduplicated and reranked. Confidence estimates can influence whether the system answers directly or routes to a more capable model. A planner can decide whether to call tools. Tool results can trigger safety checks. The final response can be blocked, transformed, or escalated.
Second, teams try a naive solution: “Let’s just log the prompts and completions.” That helps, but only briefly. You still cannot answer questions like:
- Why was this document included and that one excluded?
- Which threshold caused abstention?
- Was the route to GPT-4-class capability due to low retrieval confidence or a policy requiring premium handling?
- Did a tool call happen because the model requested it, because the orchestrator forced it, or because a deterministic policy overrode the planner?
- Which safety classifier score tripped the guardrail?
- Was a bad answer caused by stale data, ranker drift, missing metadata, prompt truncation, or policy misconfiguration?
Third, teams either mature into a decision-centric logging design or they keep paying the tax in every incident review.
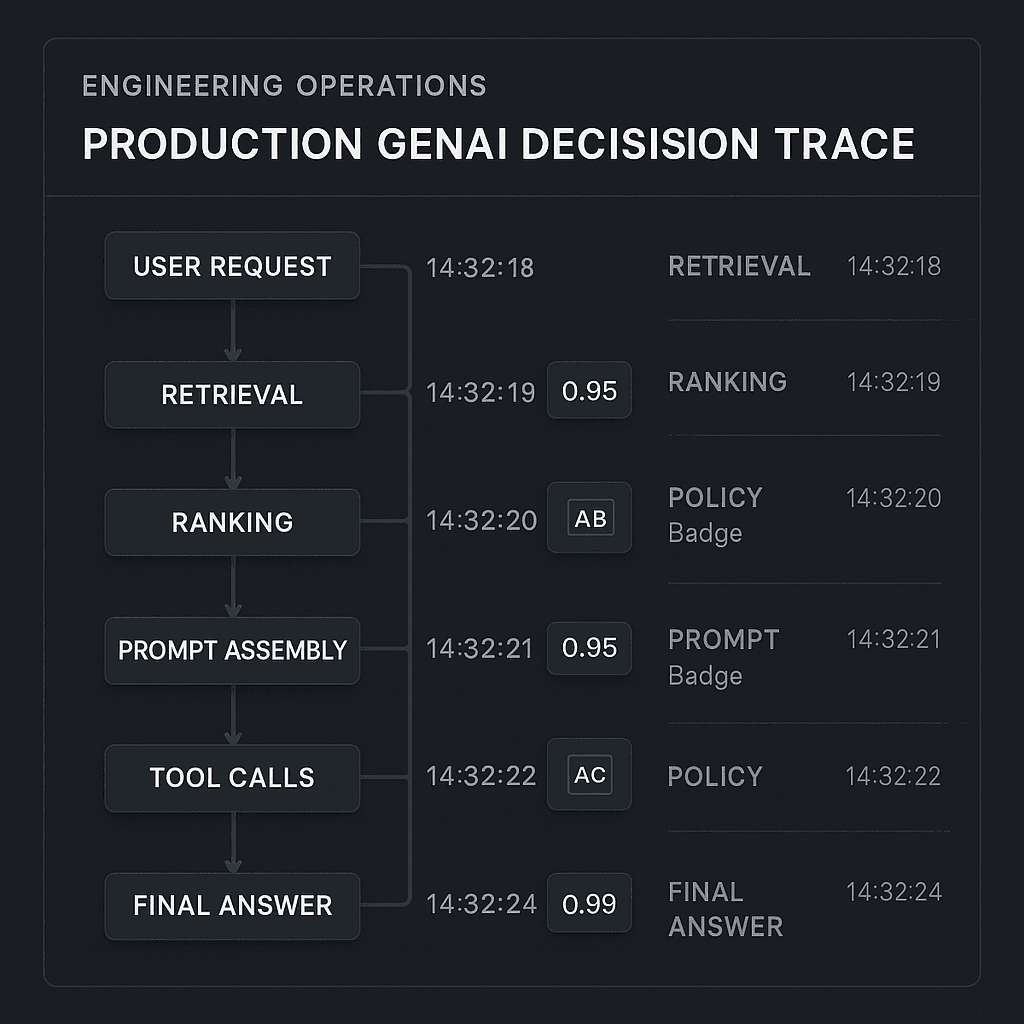
A useful mental model is that a production GenAI system is not one model call. It is a decision graph. Every node in that graph should emit a compact, structured explanation of what inputs it saw, what options it considered, what policy or model produced the choice, and why the chosen action won.
The naive approach fails for four reasons.
The first failure is overreliance on unstructured logs. Free-text logs written by application code are fine for local debugging but terrible for fleet-wide analysis. If one engineer logs “retrieval weak, switched to expensive model” and another logs “route=up_tier due to low confidence,” you have human-readable breadcrumbs but no stable schema for analytics, audits, or offline evaluation.
The second failure is logging outputs without decision context. A prompt trace may tell you that a particular set of passages was presented to the model, but not the retrieval candidates that lost, the scores they received, the thresholds in effect, the policy version evaluated, or the budget constraints that caused truncation. Without that context, postmortems devolve into guesswork.
The third failure is logging too much raw data. In panic mode, teams often dump prompts, retrieved text, tool payloads, and user metadata into a log sink. That creates privacy, security, and retention headaches immediately. Decision logs should help you understand behavior without turning your observability platform into an uncontrolled replica of sensitive data.
The fourth failure is lack of correlation across stages. Retrieval logs live in one system, ranker metrics in another, tool execution in a workflow engine, guardrail outcomes in a policy service, and LLM traces in a vendor console. Each subsystem can defend itself, but no one can reconstruct the full path of a request. What you need is a consistent request lineage with stage-level decision records.
A better approach is to treat decision logging as a first-class product of your GenAI platform architecture, not as an afterthought.
At a high level, the architecture should include five layers.
- A canonical decision event schema.
- End-to-end correlation IDs and stage spans.
- Privacy-aware feature capture.
- A decision trace store optimized for debugging and analysis.
- An offline replay and evaluation pipeline built on the trace data.
The core design principle is simple: every consequential branch in the system should produce a machine-readable event with enough evidence to explain the branch later.
A practical canonical schema looks something like this:
trace_id: unique ID for the end-user request or session turn.span_id: unique ID for this decision point.parent_span_id: links the event into a graph.timestamp.stage: retrieval, reranking, routing, planning, tool_selection, tool_execution, prompt_assembly, model_inference, safety_check, finalization, etc.decision_type: answer, abstain, route_up_tier, route_down_tier, include_doc, exclude_doc, call_tool, skip_tool, block_response, redact_output, escalate_human.decision_outcome: chosen option.candidate_options: compact list of considered options.decision_factors: structured features, scores, thresholds, policy flags, budget state.policy_inputs: sanitized policy-relevant attributes.policy_versionormodel_version.reason_codes: normalized enums, not just free text.explanation_text: optional human-readable summary.artifacts: references to prompts, documents, tool results, classifier outputs stored elsewhere.latency_ms,cost_microunits,token_counts.environment: prod, staging, canary.tenant_idor tenant hash if needed.user_risk_tier,request_risk_tier, or equivalent sanitized business context.
The critical design choice is that reason_codes and decision_factors are not prose. They are structured, versioned fields. For example, a route-up-tier event might include:
reason_codes: [LOW_RETRIEVAL_CONFIDENCE,POLICY_PREMIUM_CUSTOMER,TASK_HIGH_COMPLEXITY]decision_factors.retrieval_confidence: 0.41decision_factors.confidence_threshold: 0.55decision_factors.customer_tier:premiumdecision_factors.task_complexity_score: 0.83decision_factors.estimated_cost_delta: 0.012decision_factors.latency_budget_remaining_ms: 2800policy_version:routing_policy_v17model_version:router_xgb_2026_08_14
This makes logs actually queryable. You can later ask: “Show me all route-up-tier decisions last week caused by low retrieval confidence where the final answer still failed reviewer QA.”
What should you log at each decision point?
Start with retrieval.
For retrieval, many teams only log the final top-k documents. That is not enough. You need to understand candidate generation and filtering.
At minimum, log:
- Original query fingerprint and query-class label.
- Rewritten query variant IDs and which variant was chosen.
- Retriever types invoked: lexical, dense, hybrid, graph, metadata filter.
- Index or corpus version.
- Retrieval parameters: top-k, filters, namespaces, freshness constraints.
- Candidate document IDs or hashes, source systems, and chunk IDs.
- Raw retrieval scores and normalized scores.
- Filter reasons for exclusions: permissions, stale content, low score, bad metadata, duplicate.
- Coverage features: number of unique sources, freshness distribution, policy doc coverage, product area match.
- Aggregate retrieval confidence or sufficiency estimate.
Do not indiscriminately log full document text. Usually you need IDs, hashes, metadata, score summaries, and a stable reference to the document snapshot used at answer time. For a smaller sampled subset of traffic, or for approved secure environments, you may retain the exact chunk text for reproducibility. But make that a deliberate retention tier, not the default.
Next, reranking and context selection.
A lot of answer quality issues happen after retrieval, not during it. The correct passage may be found but dropped.
Log:
- Candidate set size entering reranking.
- Reranker model and version.
- Reranker features if using non-neural or hybrid rankers.
- Per-document reranker scores.
- Diversity, deduplication, or recency penalties applied.
- Token-budget calculations that caused truncation.
- Context assembly order.
- Included and excluded items, with reason codes such as
RERANK_BELOW_CUTOFF,TOKEN_BUDGET_EXCEEDED,SOURCE_REDUNDANT,PERMISSION_FILTERED.
This is where many teams finally discover prompt assembly was silently deleting the best evidence because a long but low-value chunk consumed too much context budget.
Then routing.
Routing is where cost and quality meet. The route could be model selection, workflow selection, human escalation, or whether to answer at all.
Log:
- Candidate routes considered.
- Features used by the router: retrieval confidence, intent class, risk class, tenant plan, user tier, estimated answerability, language, expected output length, tool necessity probability.
- Router type: rules, classifier, bandit, learned policy, LLM judge.
- Scores or logits if available.
- Thresholds and policy overrides.
- Budget state: remaining latency SLO, daily cost guardrail, tenant allowance.
- Final route and reason codes.
A common anti-pattern is using an LLM router and logging only its natural-language rationale. Keep the rationale if useful, but also log deterministic extracted features and final policy signals. Free-text explanations are poor substitutes for structured evidence.
Then planner and tool selection.
In agentic systems, teams often think the key question is “What tool did the model call?” In practice, the better question is “Why was the tool even eligible, and why did the system permit or deny that action?”
Log:
- Tool registry version.
- Eligible tools at decision time.
- Tool eligibility filters: permissions, tenant configuration, environment, safety posture.
- Planner model and prompt version.
- Proposed tool calls from the model, with arguments stored securely or redacted.
- Deterministic policy checks applied before execution.
- Whether the system forced a tool, suggested a tool, or let the model decide.
- Tool call confidence or necessity estimate if available.
- Reasons for denial:
MISSING_REQUIRED_ARG,TOOL_UNAVAILABLE,POLICY_DISALLOWED,LOW_CONFIDENCE,READ_ONLY_MODE.
This distinction matters in incident response. If a harmful action happened, you need to know whether the model invented it, the orchestration layer approved it, or the policy layer failed to block it.
Then tool execution itself.
Execution logs should include:
- Tool name and version.
- Invocation ID and correlation to planning span.
- Sanitized arguments or argument hashes.
- Validation outcomes.
- Response status and latency.
- Output schema summary.
- Error class and retry behavior.
- Side-effect classification: read-only, write, external communication, financial, identity-affecting.
- Any post-execution guardrails.
For write-capable tools, decision logging should be stricter. Capture approval paths, idempotency keys, simulation vs live mode, and any human confirmations. If an agent can send an email, change a ticket, issue a refund, or update a CRM record, your logs need to support audit-grade reconstruction.
Then prompt assembly and model inference.
Teams often think this is already covered by vendor traces. Usually it is not enough for production analysis.
Log:
- Prompt template version.
- System/developer/user message structure.
- Included retrieval artifact references.
- Included tool result references.
- Policy instructions in effect.
- Token counts by segment.
- Truncation decisions.
- Model name, version, provider, region.
- Sampling parameters.
- Cache hits or misses.
- Inference latency and cost.
- Output confidence proxy if used.
Again, be selective with raw text retention. It is often sufficient to store prompt component references, hashes, and secure retrieval pointers. Full prompt bodies can be retained under stricter controls for sampled requests, red-team cases, or short-term debugging windows.
Then guardrails and finalization.
These are the events that answer compliance and incident questions.
Log:
- Which classifiers or rule engines ran.
- Input scope evaluated: user input, retrieved content, model draft, tool arguments, tool output.
- Scores and thresholds.
- Actions taken: allow, block, redact, transform, escalate, require confirmation.
- Competing policy outcomes and precedence.
- Final answer mode: direct answer, abstention, refusal, handoff, partial answer.
- User-visible explanation category.
If the system abstains, that decision deserves as much logging detail as an answer. “No answer” is still a product behavior and often the right one. Teams that only instrument successful answers lose visibility into false abstentions and unnecessary escalations.
The hard part is capturing enough decision context without leaking sensitive data.
This is where production discipline matters. Decision logs are not a license to store everything forever. The right approach is layered.
First, classify every field by sensitivity before implementation. At a minimum, define categories such as:
- Safe operational metadata.
- Sensitive but loggable in hashed or bucketed form.
- Restricted content requiring redaction or secure enclave storage.
- Prohibited from logging.
Second, prefer references and derived features over raw content. Instead of logging the customer’s full free-text request in your analytics warehouse, log a request ID, language, intent class, risk class, token count, PII detection summary, and content hash. Instead of storing full retrieved passages, store document IDs, chunk IDs, semantic fingerprints, recency buckets, and score features.
Third, sanitize policy inputs. If routing depends on customer plan, account age, region, and whether the account is under compliance hold, you probably do not need full CRM records in the trace. You need the minimal attributes used by the policy evaluation, ideally normalized or bucketed.
Fourth, separate hot traces from cold evidence. Keep a compact, queryable event stream in your main observability path. Store raw or reconstructable artifacts in a tightly controlled evidence store with short retention, access controls, and audit logging. Decision events should contain pointers, not payload dumps.
Fifth, hash, tokenize, or bucket identifiers where exact values are unnecessary. For example, account_age_days_bucket=365_plus is often enough for policy analysis. If exact joinability is needed across systems, use stable pseudonymous IDs.
A practical privacy-aware storage pattern looks like this:
- Event stream: compact decision events, structured factors, no raw text by default.
- Artifact registry: prompt snapshots, retrieved chunk snapshots, tool IO snapshots, encrypted and access-controlled.
- Feature store: sanitized features used for routing, ranking, and guardrails.
- Join service: privileged service that can reconstruct a trace for authorized incident response.
Correlation across retrieval, ranking, prompting, and tools is what makes the whole system useful.
Use one top-level trace_id for the user-visible turn. Then create spans for each major operation and decision. If one retrieval request fans out to dense and lexical backends, each backend can get a child span. If the planner proposes three tools but only one is executed, each proposal and execution should be linked. If the answer draft is rejected by a guardrail and a second draft is generated, that should appear as an alternate branch in the same trace.
In other words, do not force the trace into a single linear chain if the runtime is not linear. GenAI workflows often branch and loop. A graph-shaped trace is a better representation.
OpenTelemetry-style tracing conventions can help for service-level spans, but you will almost always need a GenAI-specific decision schema on top. Traditional traces tell you where time went. Decision traces tell you why behavior happened.
Once you have these traces, the next leverage point is evaluation.
Decision logs are not only for firefighting. They are the raw material for offline improvement.
A strong evaluation strategy built on decision logs includes at least four layers.
First, slice-based behavioral analysis.
You should be able to ask:
- For queries labeled policy-sensitive, how often did the system abstain versus answer?
- For premium tenants, how often did routing choose the expensive model and what was the incremental quality lift?
- For cases where retrieval confidence was below 0.5, which reason codes most often preceded user dissatisfaction?
- How often do tool denials happen due to policy versus malformed arguments?
Second, counterfactual replay.
Because decision logs capture candidate options and features, you can replay historical traffic under alternative thresholds or policies without re-contacting users. Example analyses:
- If
retrieval_confidence_thresholdmoved from 0.55 to 0.48, how many more queries would have been answered directly rather than escalated, and what is the estimated quality risk? - If prompt assembly allowed top-5 instead of top-3 evidence chunks for legal-policy intents, what would token cost and latency become?
- If the route to a more capable model required both low confidence and high complexity, what spend would drop and which failure slices would worsen?
Third, label generation for supervised improvement.
Decision traces create training data for routers, abstention models, and guardrails. If incidents are annotated with root causes, you can learn patterns like:
- Retrieval found evidence but prompt assembly dropped it.
- Tool was necessary but planner skipped it.
- Safety block was false positive due to classifier threshold.
- Expensive route added no quality value for simple requests.
This is far more actionable than labeling only final answer quality.
Fourth, audit and compliance evaluation.
For regulated or high-risk domains, evaluate whether required policies were consistently applied. For example:
- Did all financial-impacting write actions require explicit confirmation?
- Did all healthcare advice responses include required retrieval provenance?
- Were all high-risk requests routed through approved models and regions?
- Were all user-visible refusals accompanied by approved explanation categories?
Model and tool comparisons become much easier when decision logs exist.
Suppose you want to compare two rerankers. Without decision logs, you might run generic answer-level A/B tests and wait weeks. With decision logs, you can compare:
- Rank position of gold-supporting documents.
- Context inclusion rate of required passages.
- Token overhead from larger context sets.
- Latency added by reranking.
- Downstream impact on abstentions, tool use, and guardrail triggers.
Similarly, comparing routers becomes concrete:
- Rule-based router: lower latency, deterministic, easy to audit, weaker adaptation.
- Gradient-boosted tree or lightweight classifier: strong structured-feature routing, cheap, easier to calibrate than LLM routers.
- LLM router: flexible for messy inputs, potentially better zero-shot routing, but slower, more expensive, and harder to calibrate and audit.
In many production systems, the best pattern is hybrid. Use deterministic rules for hard policies, a lightweight learned router for most route selection, and reserve LLM routing for ambiguous cases where the extra cost buys quality. Decision logs should make those fallback boundaries visible.
The same applies to tool orchestration. Pure model-driven agent loops are attractive in demos but often expensive and hard to control in production. A practical architecture usually constrains them:
- Deterministic preconditions decide whether a tool class is even eligible.
- A planner proposes actions within the eligible set.
- A validator checks arguments and side-effect risk.
- A policy layer approves or blocks execution.
- A postcondition checker evaluates outputs before final response.
Each gate emits a decision log. That is how you keep “agent behavior” from becoming irreducible magic.
There are real cost and latency tradeoffs in all this instrumentation.
Logging every candidate score, feature, and artifact reference adds storage and processing cost. Full-fidelity traces can also inflate response latency if you synchronously write too much data.
A battle-tested approach is tiered observability:
- Always-on minimal events for every request: decisions, reason codes, core features, IDs, scores, latency, cost.
- Elevated detail for sampled traffic, high-risk intents, errors, escalations, and canaries.
- Full artifact capture for incidents, red-team sessions, offline benchmark runs, or explicitly approved cohorts.
Emit decision events asynchronously where possible. If the trace pipeline is down, the user-facing path should degrade gracefully. Local buffering plus eventual flush is usually better than hard dependency on the logging sink.
Compression matters too. Storing every retrieval candidate as a verbose JSON blob is expensive. Prefer compact schemas, enumerated reason codes, feature dictionaries with versioned definitions, and references rather than repeated payloads.
Implementation details matter more than elegant diagrams.
A practical rollout plan looks like this.
Phase 1: define the decision taxonomy.
Write down all consequential branches in your system. For each one, specify:
- Decision name.
- Available options.
- Required reason codes.
- Required structured factors.
- Sensitivity classification of each field.
- Owning team.
- Versioning policy.
If you skip this taxonomy step, every team will invent its own semantics and your logs will become a graveyard of near-duplicates.
Phase 2: instrument the minimum viable trace.
Start with the decisions that most affect quality, cost, and risk:
- Retrieval include/exclude.
- Context inclusion/truncation.
- Route selection.
- Tool approval/denial.
- Guardrail outcomes.
- Final answer vs abstain.
Do not wait for perfect coverage before shipping. Partial decision visibility is vastly better than none.
Phase 3: build a trace viewer for humans.
Engineers need more than a warehouse table. Build or adopt a UI that shows the request timeline or graph, key decisions, candidate options, reason codes, and linked artifacts. Incident response accelerates dramatically when one person can open a trace and say, “The retrieval was fine. The reranker lost the policy chunk due to diversity penalty, then the router still answered because answerability threshold was stale.”
Phase 4: connect traces to evals.
Every benchmark case and every manually reviewed incident should map back to the same decision schema used in production. That alignment is how you stop evals from becoming detached from reality.
Phase 5: close the loop with policies and models.
Use the traces to update thresholds, retraining labels, prompt templates, and tool policies. The metric is not “we logged more.” The metric is “we reduced mean time to root cause, improved auditability, and made offline improvements that survive contact with production.”
A few practical patterns help a lot.
Use stable reason codes.
Examples:
LOW_RETRIEVAL_CONFIDENCERERANK_BELOW_CUTOFFTOKEN_BUDGET_EXCEEDEDPOLICY_REQUIRES_PREMIUM_MODELTOOL_REQUIRED_FOR_FRESH_DATATOOL_DENIED_MISSING_PERMISSIONSAFETY_BLOCK_SELF_HARMABSTAIN_INSUFFICIENT_EVIDENCEESCALATE_HUMAN_HIGH_IMPACT
These become the language of your postmortems.
Version everything that can change behavior.
That includes prompt templates, retrieval indexes, rerankers, routing models, thresholds, policy bundles, classifier versions, and tool registry snapshots. If a behavior changed, you need to know whether the code changed, the model changed, the policy changed, or the corpus changed.
Distinguish observed facts from inferred judgments.
For example, “retriever score = 0.63” is a fact. “retrieval confidence = high” is a derived interpretation. Log both, but do not confuse them. This matters when debugging calibration drift.
Capture non-decisions where important.
Sometimes the most important fact is that a check did not run. If a guardrail was skipped due to timeout or a tool validator was bypassed in fail-open mode, that should be explicit in the trace.
Record budgets at decision time.
Latency and cost constraints shape behavior. If the system truncated context because only 200 ms remained in the SLO budget, that belongs in the explanation. Otherwise teams will misdiagnose budgeted behavior as model quality failure.
Treat incident response as a first-class user of the system.
Your security, legal, support, and compliance stakeholders need different trace views than ML engineers. The same underlying decision log should support all of them, with role-based access to sensitive artifacts.
There are also anti-patterns worth avoiding.
Do not use the model’s self-explanation as the sole reason record. It can be useful context, but it is not authoritative.
Do not log unrestricted raw prompts and tool payloads by default. You will regret it.
Do not let each microservice define incompatible fields for the same concept like confidence, threshold, or route reason.
Do not build a giant trace system with no connection to improvement workflows. If traces do not feed evals, audits, and postmortems, they will become expensive shelfware.
Do not optimize only for successful debugging of one incident. Optimize for recurring analysis across thousands of requests.
If you want a simple reference architecture, use this:
A request enters an orchestration service that creates a trace_id. A query analysis component emits intent and risk assessment events. Retrieval fans out to lexical and dense backends, each returning candidate references and scores. A consolidation step emits include/exclude reasons and aggregate sufficiency features. A reranker emits per-candidate scores and context-cutoff reasons. A router consumes sanitized request features plus retrieval sufficiency, applies deterministic policy rules first, then a lightweight learned router, and emits a route decision. Prompt assembly records template version, included artifact references, and token-budget actions. If tool use is enabled, the planner emits proposed actions, a validator emits approval or denial events, and execution emits side-effect-classified results. Safety and compliance checks emit classifier scores, thresholds, and actions. Finalization emits whether the user received an answer, abstention, refusal, or handoff, along with provenance references and user-visible explanation category.
All of those events flow asynchronously into a trace store keyed by trace_id, with links to an encrypted artifact store and a feature warehouse. A trace viewer supports incident analysis. An offline pipeline uses the same traces for slice analysis, replay, threshold tuning, and training-data generation.
That sounds heavyweight, but it is lighter than repeated production confusion.
The big takeaway is that production GenAI systems need a memory of their own decisions. Not just what text they saw and produced, but why they selected evidence, chose a route, invoked a tool, blocked a draft, or declined to answer.
When teams implement decision logs well, several things change quickly.
Debugging gets faster because incidents become traceable instead of mystical.
Audits get easier because policy enforcement becomes inspectable.
Safety improves because guardrail outcomes are visible and measurable.
Costs go down because routing and tool-use decisions can be tuned with evidence rather than hunches.
Offline improvement gets real because you can replay choices and learn from the exact branch points that shaped user outcomes.
And perhaps most importantly, cross-functional trust improves. Product, legal, security, and support no longer hear “the model decided.” They hear, “The system answered because retrieval sufficiency exceeded threshold, the premium-policy override did not apply, no required tool was eligible, and the final draft passed the harassment and financial-risk guardrails under policy bundle v23.”
That level of explanation does not remove the complexity of GenAI systems. But it makes the complexity legible, governable, and improvable.
In production, that is the difference between a clever demo and an operating system your team can actually run.