Capacity Planning for Production GenAI: Sizing Tokens, Throughput, and Concurrency Before Your Launch Fails
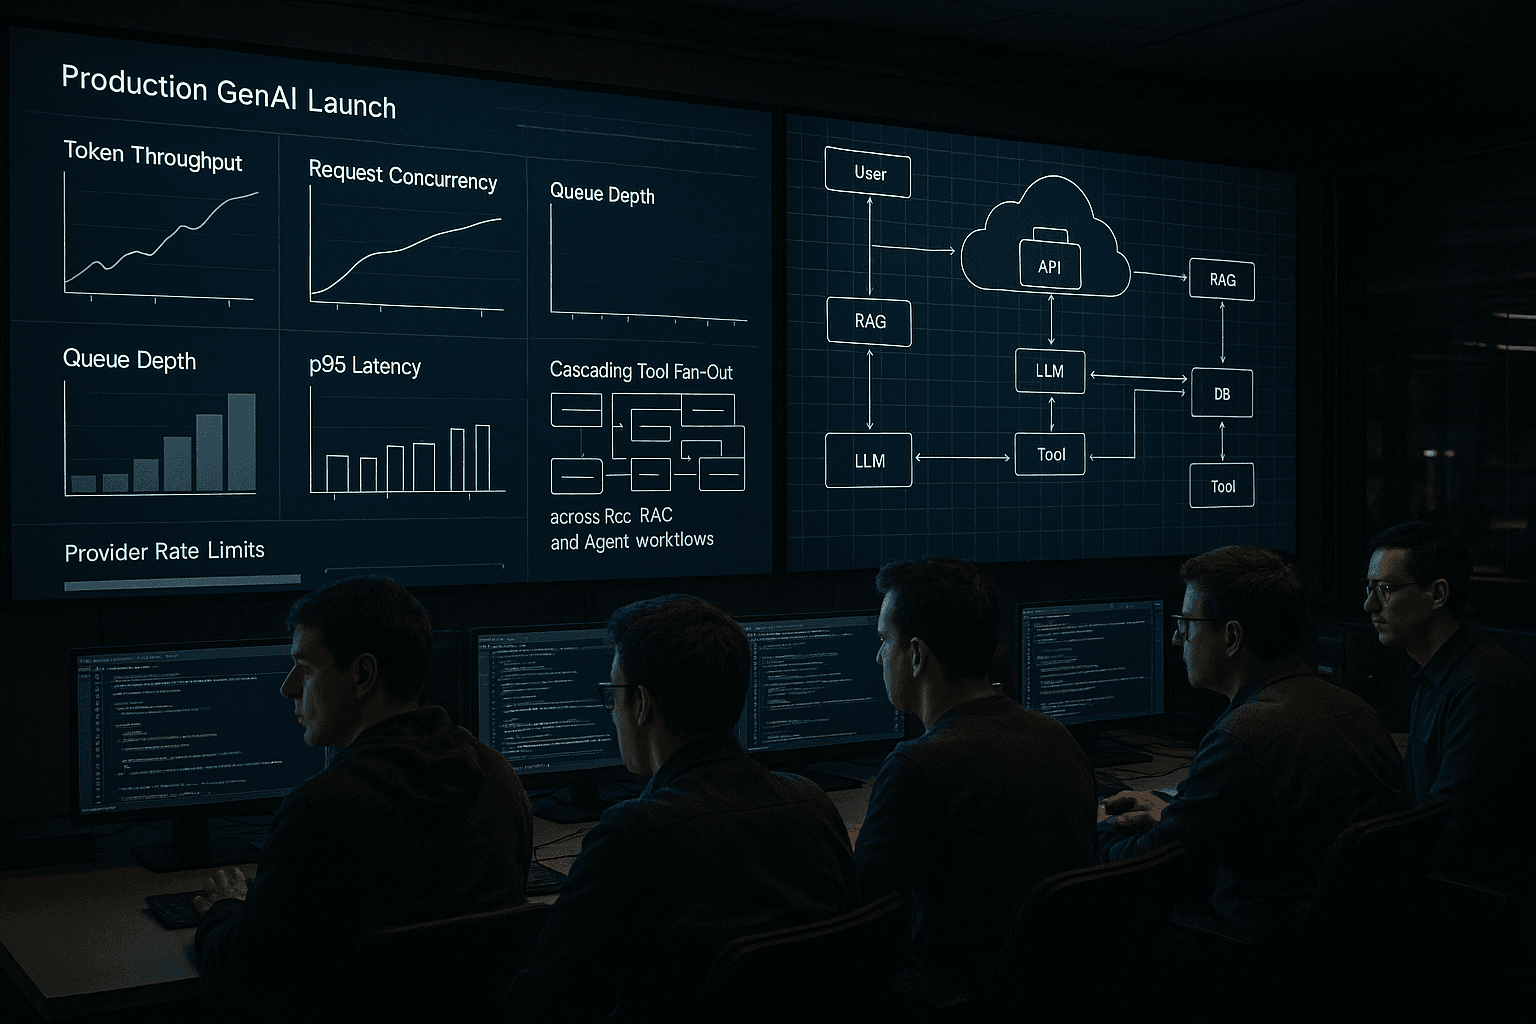
A week before launch, the demo system looked great.
The team had built a polished support copilot on top of a retrieval pipeline, a hosted LLM, and a handful of internal tools. In staging, everything felt fast. The median response time was under five seconds. The model vendor’s dashboard looked healthy. A few thousand test questions had passed. Product was confident enough to announce the launch at the company all-hands.
Then the launch email went out.
Traffic spiked to 8x the busiest staging hour. Retrieval still held up, but generation latency stretched. Requests piled up behind model calls. The first failure mode was subtle: users saw partial streaming responses that stalled for 20 to 40 seconds before finishing. Then a more visible one hit: tool-using requests started timing out because the orchestrator waited on multiple subcalls, some of which were already queued behind provider-side rate limiting. By the time the team noticed queue depth rising, retries had amplified load, and the “fallback” model started failing too because it shared the same regional quota pool. The support copilot did not exactly go down. It just became unpredictably slow, expensive, and embarrassing.
This is the common GenAI launch failure mode: the system works functionally, but nobody really sized the token economy, concurrency profile, long-tail latency, or orchestration fan-out under realistic load.
Capacity planning for GenAI is not just “how many requests per second can my API handle?” It is a multi-stage flow problem where requests expand into tokens, tokens expand into time, tools expand into subrequests, retries amplify pressure, and provider quotas create hard ceilings in the middle of your critical path. If you do not model this before launch, you are usually planning around averages that disappear the moment a real burst arrives.
What follows is a practical guide to avoiding that failure. I’ll focus on production systems, especially RAG and agent workflows, where token volume, concurrency, queueing, and external quotas interact in non-obvious ways.
The pattern: GenAI capacity failures are usually token-and-concurrency failures, not CPU failures
Traditional web capacity planning often starts with host-level resources: CPU, memory, database connections, network bandwidth. Those still matter, but GenAI systems usually fail first on different dimensions:
- Model provider tokens-per-minute or requests-per-minute quotas
- In-flight request concurrency limits at the provider or your gateway
- Long-tail latency from large prompts or slow decoding
- Tool fan-out multiplying total work per user request
- Queue growth in orchestrators, workers, or streaming gateways
- Retry storms caused by timeouts, 429s, or partial failures
- Cost ceilings that act like practical capacity limits even if technical capacity exists
A useful mental model is this:
User requests are not the primary unit of capacity. Tokens and workflow expansions are.
A “single” user request may involve:
- Query rewriting
- Embedding generation
- Vector retrieval
- Re-ranking
- Main model generation
- Tool selection
- One or more tool invocations
- One or more follow-up model calls to integrate tool results
- Safety or policy checks
- Logging, tracing, and evaluation sidecar work
In a simple RAG flow, one user request may become 2 to 4 model/API calls. In an agent workflow, it may become 5 to 30. If each call has different token patterns and latency distributions, “100 requests per second” is not a meaningful sizing input by itself.
Why the naive approach fails
Most teams make one or more of these mistakes.
1. Planning on average prompt sizes
They take an average input token count from a sample dataset, estimate average output length, and multiply by expected requests per minute.
That fails because GenAI traffic is heavy-tailed.
Your median support question may be 300 input tokens and 500 output tokens, but your p95 request might carry:
- long chat history
- retrieved passages from multiple documents
- policy boilerplate
- tool results pasted back into the prompt
- chain-of-thought-like hidden scaffolding in your orchestration layer
It is common for p95 or p99 token volume to be several times the median. If provider quotas are token-based, the tail dominates capacity consumption exactly when traffic spikes.
2. Ignoring concurrency induced by model latency
Concurrency is approximately arrival rate multiplied by service time.
If your arrival rate is 20 requests/second and model time is 2 seconds, you need around 40 in-flight requests just to stay even. If service time stretches to 8 seconds under heavier prompts, you now need 160 in-flight slots. The traffic did not change; latency did.
Teams often validate at low prompt sizes, see acceptable latency, and conclude they can handle launch volume. But model latency grows with prompt length, output length, provider load, and tool round trips. As latency increases, concurrency requirements rise, queue depth rises, and the system spirals.
3. Treating retries as free
Retries are often implemented with good intentions and disastrous math.
Suppose your orchestrator retries 429s twice with little jitter. Under quota pressure, a 10% failure rate can quickly become 20 to 30% extra load. If multiple layers retry independently, you get multiplicative amplification. This is one of the fastest ways to turn a manageable burst into a system-wide incident.
4. Missing fan-out in tool-using or agentic flows
An agent that “usually” calls one tool is not a one-tool system. You need to size for the actual distribution:
- no-tool requests
- one-tool requests
- multi-tool requests
- recursive or iterative planning loops
- parallel tool calls
- repair loops when parsing/tool invocation fails
Even if the average fan-out looks small, the tail matters because those requests tie up orchestrator workers longer and often consume more model tokens both before and after tool execution.
5. Load testing requests instead of workflows
Teams often run synthetic load tests that repeatedly hit a short happy-path prompt. That measures the wrong thing.
A good GenAI load test must reflect:
- realistic input token distribution
- realistic output token distribution
- realistic retrieval payload sizes
- streaming behavior
- cache hit and miss patterns
- realistic proportions of no-tool, one-tool, and multi-tool requests
- burst arrival shapes
- provider quota behavior
- timeout and retry policies
If your load test does not include these, you are testing transport plumbing, not launch readiness.
A better approach: model your system as a token-driven queueing network
The practical way to plan GenAI capacity is to model the end-to-end workflow as a set of service centers with token-driven demand and concurrency constraints.
At minimum, define these components:
- Ingress: user/API requests arriving over time
- Orchestrator: application server, workflow engine, or agent runtime
- Retrieval path: embeddings, vector DB, search, reranking
- Model path: one or more LLM calls with token-based service times and quotas
- Tool path: internal/external tools with their own latency and concurrency limits
- Streaming gateway: infrastructure holding open client connections
- Queues: explicit or implicit buffers at worker pools, task queues, and provider endpoints
- Control plane: admission control, rate limiting, retries, backpressure, degradation, fallback
Then size the system using four core quantities:
- Demand rate: requests/sec, tokens/sec, tool calls/sec
- Service time: per stage, including tail latency
- Concurrency: in-flight work = arrival rate × service time
- Headroom: what you reserve for bursts, failover, and vendor variance
The first sizing equation: token throughput
For each model call type, estimate:
- input tokens/request
- output tokens/request
- calls per workflow
- workflows/sec at steady state and burst
Then compute:
token throughput = workflows/sec × calls/workflow × tokens/call
Do this separately for input and output tokens if your provider quotas distinguish them, and separately by model.
Example for a RAG assistant at steady state:
- 12 workflows/sec
- 1.2 generation calls/workflow on average
- 4,500 input tokens/call
- 700 output tokens/call
That yields roughly:
- Input: 12 × 1.2 × 4,500 = 64,800 input tokens/sec
- Output: 12 × 1.2 × 700 = 10,080 output tokens/sec
Convert to provider quota units if needed:
- 3.89M input tokens/min
- 605k output tokens/min
If your provider allows only 2M tokens/min on that model in your region/project, the launch fails before any CPU graph looks stressed.
The second sizing equation: concurrency
For each stage:
required concurrency ≈ arrival rate × service time
For the main generation call:
- 12 workflows/sec
- 1.2 calls/workflow
- p95 service time 6 sec
Concurrency required at p95:
12 × 1.2 × 6 = 86.4 in-flight model calls
If your provider, gateway, or SDK pool effectively caps in-flight requests at 50, you will queue.
For streaming products, remember that service time lasts until the final token is emitted, not first-token time. Teams often celebrate fast time-to-first-token while underestimating how long connections stay open.
The third sizing equation: fan-out expansion
For agents or tool-using systems:
effective work per workflow = Σ(step probability × step cost)
A simple example:
- 50% no-tool requests: 1 model call
- 35% one-tool requests: 2 model calls + 1 tool
- 15% multi-tool requests: 4 model calls + 3 tools
Average model calls/workflow:
0.50×1 + 0.35×2 + 0.15×4 = 1.8
Average tool calls/workflow:
0.50×0 + 0.35×1 + 0.15×3 = 0.8
This is already much larger than assuming “one model call per request.” But average is not enough. You should also track the p95 workflow expansion, since queue and latency pressure are often created by the tail.
The fourth sizing equation: queue stability
For each constrained stage, your utilization must remain below 1 with margin.
In practice, keep sustained utilization materially below saturation, especially for high-variance service times. GenAI service times are high-variance. That means your safe utilization target may be much lower than in deterministic systems.
As a rule of thumb:
- below 50 to 60% sustained utilization is comfortable for volatile interactive workloads
- 60 to 75% may be acceptable with strong admission control and short queues
- above 80% sustained utilization is where tail latency usually becomes ugly fast
This is particularly true for model calls with token-length variability.
Architecture patterns that survive launch-day reality
Capacity planning is not just forecasting. You need architecture that can enforce your plan.
1. Separate admission control from execution
Do not let every inbound request proceed immediately into expensive orchestration. Put an explicit admission layer in front of the workflow.
Admission control should evaluate:
- tenant priority
- current queue depth
- current model quota consumption
- available in-flight concurrency
- expected workflow class cost
- current degradation mode
A good admission decision is not simply allow/deny. It can route requests into classes such as:
- full experience
- reduced-context experience
- cheaper-model experience
- async/deferred experience
- reject with retry-after
If you only discover overload after the request has already expanded into retrieval, planning, and tool calls, you waste precious capacity.
2. Classify workflows by expected cost
Not all requests should consume equal capacity.
Create request classes using predicted cost drivers:
- chat continuation vs fresh question
- likely short-answer vs document-heavy synthesis
- no-tool vs likely tool use
- standard vs premium tenant
- interactive vs batch
Then reserve capacity by class. This prevents low-value long-running requests from crowding out short, high-priority ones.
A simple policy might reserve:
- 50% of model concurrency for interactive user-facing traffic
- 20% for premium tenants
- 20% for internal ops/admin
- 10% for background or batch jobs
Without class-based isolation, one background summarization job can starve your product launch.
3. Put hard caps on workflow expansion
Agent frameworks make it easy to accidentally build unbounded loops.
Set explicit limits on:
- max model calls per workflow
- max tool invocations per workflow
- max parallel tool fan-out
- max prompt growth from accumulated context
- max wall-clock time per workflow
- max retries per step and per workflow
These are not just safety controls. They are capacity controls.
4. Make backpressure visible across all layers
You need a coherent backpressure story from provider quota all the way to the client.
Examples:
- if provider tokens/min are near exhaustion, reduce admission rate
- if orchestrator queue depth rises, stop launching optional side tasks
- if tool pool saturates, disable multi-tool plans
- if streaming connections exceed safe thresholds, switch some cohorts to non-streaming or shorter outputs
Backpressure should propagate upstream intentionally. Otherwise, every layer keeps accepting work until the whole graph locks up.
5. Decouple interactive and asynchronous workloads
This sounds obvious, but teams still route evals, indexing, nightly enrichment, and user-facing traffic through the same model account or quota pool.
Separate these when possible:
- provider projects/accounts
- API keys and quotas
- worker pools
- queues
- model deployments
- regional endpoints
If separation is impossible, at least implement quota reservations and time-based throttling.
SLOs first, then capacity
Capacity planning is impossible without explicit service objectives.
For a production GenAI system, define SLOs at least at these layers:
User-facing SLOs
- p50/p95 time to first token
- p50/p95 time to final token
- success rate by request class
- timeout rate
- degraded-response rate
Workflow SLOs
- completion rate by workflow type
- average and p95 steps/workflow
- tool failure rate
- tool fallback rate
- truncation rate due to guardrails or budget limits
Infrastructure SLOs
- queue wait p95
- model 429 rate
- model timeout rate
- worker pool saturation
- streaming connection utilization
- retrieval latency p95
Cost SLOs
- cost/request by class
- cost/token by model path
- daily budget burn and projected overrun rate
Once these exist, capacity planning becomes a multi-objective exercise:
- meet latency SLOs
- meet success-rate SLOs
- stay under cost envelope
- maintain headroom for bursts and incidents
That is a more realistic target than “maximize throughput.”
Forecasting demand: use distributions, not point estimates
A launch forecast should include at least three scenarios:
- Expected day-one traffic
- Success case burst: marketing, internal dogfooding, social amplification
- Failure amplification case: retries, refreshes, repeated user attempts because latency is poor
For each scenario, estimate:
- requests/sec over time
- request class mix
- token size distribution
- session behavior and multi-turn continuation rates
- burstiness factor within 10-second and 60-second windows
Burstiness matters because many provider limits are enforced per minute or per smaller rolling window, while your product may experience synchronized spikes after announcements, page loads, or batch-triggered events.
A practical demand model
For each request class, forecast:
arrival_rate_meanarrival_rate_p95_windowinput_tokens_p50/p95/p99output_tokens_p50/p95/p99model_calls_p50/p95tool_calls_p50/p95stream_duration_p50/p95
Then simulate aggregate demand over realistic intervals such as 1 sec, 10 sec, 60 sec, and 5 min windows.
This catches a common mistake: you may be under provider minute-level quota on average but still overload your own in-flight concurrency during 10-second bursts because decoding takes longer than expected.
Rate limits: the hidden dependency that decides whether you launch smoothly
Provider rate limits are often the hardest capacity constraint because they are external, dynamic, and sometimes not cleanly documented at the exact granularity you need.
Track at least these separately:
- requests per minute
- input tokens per minute
- output tokens per minute
- concurrent requests or sessions
- per-model limits
- per-region limits
- per-account or per-project shared pools
Then map them to your workflow graph.
Common quota traps
- Primary and fallback models share the same quota pool
- Staging and production share the same org/project budget or rate bucket
- Embeddings and generation share limits unexpectedly
- Regional routing changes effective capacity or latency
- Burst handling at the provider is worse than the nominal quota suggests
- Streaming requests occupy concurrency longer than expected
You should ask providers direct questions before launch:
- Are quotas hard or soft?
- Are they per minute, per rolling window, or token bucket?
- Are input and output tokens counted separately?
- Are retries counted even on 429/5xx?
- Do fallback deployments share capacity pools?
- Are there hidden concurrency caps beyond RPM/TPM?
- What happens during regional failover?
Do not discover these experimentally during launch week.
Model selection is a capacity decision, not only a quality decision
Teams often choose models on benchmark quality and per-token price, but for production capacity planning you must also compare:
- latency under realistic prompts
- output speed and variance
- max context size actually usable at target latency
- quota availability
- regional deployment footprint
- stability under burst load
- tool-calling reliability and repair-loop frequency
A larger model with better benchmark quality can be the wrong launch choice if:
- its latency increases required concurrency too much
- its available TPM quota is too low
- it tends to produce overly long outputs
- tool-call formatting failures trigger repair retries
In many systems, the best production architecture is tiered:
- small/fast model for classification, routing, query rewrite, or guardrails
- medium model for most user-facing generation
- large model only for premium paths, hard cases, or async follow-up
This reduces both cost and capacity pressure.
RAG-specific capacity considerations
RAG adds its own bottlenecks, but the biggest launch-day mistake is underestimating how retrieval inflates prompt size.
Track these separately:
- embedding calls/sec and embedding TPM
- vector search QPS and latency
- reranking throughput and latency
- retrieved chunks per request
- average and p95 tokens from retrieved context
- context trimming behavior and quality impact
Why naive RAG sizing fails
A common pattern:
- staging used top-k = 4 with short chunks
- production corpus has longer documents
- retrieval returns 8 to 12 chunks after a relevance threshold change
- prompt assembly now adds 3x more tokens
- model latency jumps
- in-flight concurrency rises
- provider TPM hits quota sooner
Nothing “broke” in retrieval, but the generation path gets crushed.
Better RAG capacity controls
- cap total retrieved-context tokens, not just chunk count
- use smaller chunks with stronger reranking instead of blindly increasing top-k
- cache embeddings aggressively for repeated content
- classify low-value queries into cheaper retrieval/generation paths
- precompute summaries for common documents so you can inject compressed context
- monitor retrieval token contribution as a first-class metric
Agent-specific capacity considerations
Agents fail capacity planning because they turn one user action into an uncertain amount of work.
Treat every agent workflow as a bounded search process with a budget.
Define budgets for:
- total tokens/workflow
- total steps/workflow
- total tool calls/workflow
- total external API time/workflow
- total wall-clock time/workflow
Tool fan-out is the silent killer
Suppose an agent can call 5 APIs in parallel to build an answer. Great for median latency, maybe disastrous for shared dependencies.
If 100 user workflows each spawn 5 parallel tools, you just created 500 tool requests plus follow-up model integration steps. If one of those tools is itself rate-limited, the orchestrator may hold open all parent workflows while waiting, consuming memory, worker slots, and streaming connections.
Parallelism improves latency only if downstream capacity exists. Otherwise it shifts bottlenecks and increases blast radius.
Practical agent controls
- allow parallel tools only for approved low-latency/high-capacity tools
- use planner/executor separation so a cheap model decides whether expensive steps are needed
- stop after first sufficient answer when appropriate
- enforce per-tool concurrency caps
- fail closed on flaky tools instead of repeated repair loops
- downgrade to direct-answer mode under pressure
Load testing: test token shapes, not just endpoint hits
A realistic GenAI load test should replay the workflow mix and token distributions you expect in production.
Your load test data should include:
- short, medium, and long prompts
- realistic chat history accumulation
- retrieval payload variation
- output length variation
- tool/no-tool branching
- malformed tool responses and retry scenarios
- provider throttling simulation
- degraded modes and fallback routes
What to measure during load test
At every stage, capture:
- arrival rate
- start rate vs completion rate
- queue wait time
- service time
- in-flight concurrency
- timeout rate
- retry count
- token throughput
- 429 and 5xx rates
- effective cost/sec
And for user experience:
- first-token latency
- final-token latency
- stall rate during streaming
- degraded response frequency
- abandonment proxies if available
A good test progression
- Baseline: expected traffic, no failures
- Burst: 3 to 10x traffic spike for short windows
- Tail-heavy: same request rate, but p95/p99 token sizes dominate
- Quota squeeze: reduce model quota artificially
- Tool degradation: slow or fail one dependency
- Fallback event: shift traffic to backup model/path
- Retry amplification: validate jitter, caps, and circuit breaking
Do not sign off launch readiness until the system has shown stable degradation behavior, not just happy-path throughput.
Admission, degradation, and backpressure policies that actually work
If you only have one overload response—keep trying until timeout—you do not have an overload policy.
You need explicit decisions for when demand exceeds safe capacity.
Admission policy options
- queue up to a bounded delay budget
- reject immediately with retry-after
- reserve slots for premium or interactive classes
- shed low-priority async work
- downgrade likely-expensive requests before execution
Degradation policy options
- shorter max output tokens
- reduced retrieved context
- disable multi-tool plans
- disable parallel tool fan-out
- route to smaller/faster model
- return summary-first, expand-on-demand UX
- switch from synchronous to async completion
Backpressure policy options
- token bucket at ingress by tenant/class
- concurrency semaphores per model and per tool
- bounded queues with expiry
- circuit breakers on failing providers/tools
- adaptive retry with jitter and budget awareness
The key is to define these ahead of time and automate transitions using observed metrics, not operator intuition during incident response.
Implementation details: what to instrument and compute
Here is the minimum telemetry I would insist on before a launch.
Per request/workflow
- request class
- tenant
- start and end timestamps
- admission decision
- queue wait time
- model calls count
- tool calls count
- total input tokens
- total output tokens
- retrieved-context tokens
- retries by stage
- degraded mode flags
- final outcome
Per model call
- model name/deployment/region
- input tokens
- output tokens
- time to first token
- total latency
- streaming duration
- HTTP/provider status
- retry count
- queue wait before dispatch
Per tool call
- tool name
- latency
- status
- concurrency at dispatch
- retries
- payload size
Derived metrics
- tokens/sec by model
- in-flight model calls by model
- in-flight workflows by class
- queue depth and age by stage
- cost/min by class and model
- estimated quota exhaustion time
- p95/p99 latency by class
- workflow expansion ratio = total subcalls / user request
With this data, you can build a real-time capacity dashboard that answers:
- Are we constrained by tokens, RPM, concurrency, queue wait, or tool latency?
- Which workflow class is consuming disproportionate capacity?
- Is prompt growth driving the incident?
- Are retries helping or harming?
- How much headroom remains right now?
A simple planning worksheet
Before launch, create a worksheet or script that calculates for each request class:
- Arrival rate at p50 and burst windows
- Model calls/workflow at p50 and p95
- Tool calls/workflow at p50 and p95
- Input and output tokens/call at p50, p95, p99
- Service time/call at p50 and p95
- Required concurrency per stage
- Total TPM/RPM by model at steady and burst
- Queue growth under constrained scenarios
- Cost/hour and cost/day
- Degradation trigger points
Then stress the worksheet with scenarios:
- provider TPM reduced by 30%
- latency increased by 2x
- tool fan-out p95 doubled
- retrieval context grew by 50%
- retry rate rose from 2% to 10%
If the system only works in the optimistic scenario, it is not launch-ready.
Cost and latency tradeoffs you will have to make
There is no universal optimum. Capacity planning forces product tradeoffs.
Tradeoff 1: bigger context vs throughput
More context may improve answer quality, but it increases:
- input tokens
- model latency
- in-flight concurrency
- cost
- exposure to quota ceilings
You often get better production outcomes from tighter retrieval and better reranking than from simply stuffing more context into the prompt.
Tradeoff 2: longer outputs vs user-perceived quality
Verbose answers feel impressive in demos but are expensive and tie up capacity. In production, concise first answers with optional expansion often outperform maximal outputs on both UX and system stability.
Tradeoff 3: parallel tools vs dependency saturation
Parallelism lowers median latency when downstreams are healthy, but it increases peak dependency load and can worsen tail behavior. Use it selectively.
Tradeoff 4: fallback models vs shared quota risk
A fallback only adds resilience if it is operationally independent enough. If both models share quotas, regions, or account-level rate limits, your “fallback” may be a comforting illusion.
The launch checklist I’d use
Before approving a GenAI launch, I would want affirmative answers to these questions:
- Do we know p50/p95/p99 input and output token distributions by workflow class?
- Do we know average and p95 workflow expansion into model/tool calls?
- Have we sized against provider TPM/RPM/concurrency quotas with burst headroom?
- Have we measured p95 queue wait and in-flight concurrency under realistic token distributions?
- Do we have explicit budgets for tokens, steps, tools, and wall-clock time per workflow?
- Are interactive and batch workloads isolated?
- Do we have admission control before expensive orchestration starts?
- Do we have predefined degradation modes and automated triggers?
- Have we tested quota squeeze, tool slowdown, and retry amplification?
- Can we observe which stage is the bottleneck in real time?
- Is our fallback path actually independent enough to matter?
- Do product and leadership understand the user-visible behavior under overload?
If several of these are “no,” your risk is not abstract. It is launch-day probability.
The core takeaway
Production GenAI capacity planning is not a standard web autoscaling problem with an LLM bolted on. It is a token-driven, latency-sensitive, quota-constrained workflow system where one user request can expand unpredictably into many expensive suboperations.
That means the right planning unit is not requests alone. It is:
- tokens
- in-flight concurrency
- queue wait
- workflow expansion
- dependency quotas
- degradation behavior
The teams that launch smoothly are not the ones with the prettiest demo. They are the ones that know, in advance, what happens when prompt sizes grow, users arrive in bursts, tools fan out, provider quotas tighten, and p95 latency doubles.
Do the math before launch. Instrument the workflow, not just the endpoint. Load test realistic token patterns. Put admission and degradation policies in front of the expensive path. Reserve headroom for the long tail, not just the median.
If you do that, launch day becomes a scaling exercise instead of an incident retrospective.