Architecting PII-Safe Logging for Production GenAI: Redaction, Sampling, and Trace Design Without Losing Debuggability
Most teams discover their logging problem the same way: during an incident.
A support escalation comes in from a large customer. Their internal compliance team has found snippets of employee SSNs in an observability tool. Or a developer is debugging a retrieval failure and pastes a raw trace into Slack, not realizing the tool payload contains medical notes. Or a red-team review asks a simple question — “show me every place a user prompt can be stored” — and nobody can produce a confident answer.
The uncomfortable part is that none of this usually comes from obviously reckless engineering. It comes from normal debugging instincts. GenAI systems are hard to reason about, and when quality drops, latency spikes, or agents behave strangely, the first reflex is to log everything: full prompts, full responses, chunk payloads, tool inputs, tool outputs, chain-of-thought-like intermediates, reranker features, session histories, and raw exception objects. That strategy works right up until the day the logs themselves become the highest-risk data store in the company.
This is especially common in GenAI because the application boundary is porous. Traditional apps may log typed fields with known schemas. GenAI applications log free text, retrieved documents, screenshots, support tickets, CRM notes, emails, code, PDFs, and tool responses from systems that were never designed with observability minimization in mind. Sensitive data doesn’t just come from the user. It comes from retrieval, from tools, from upstream integrations, from previous turns, and sometimes from the model inventing or echoing data in unexpected places.
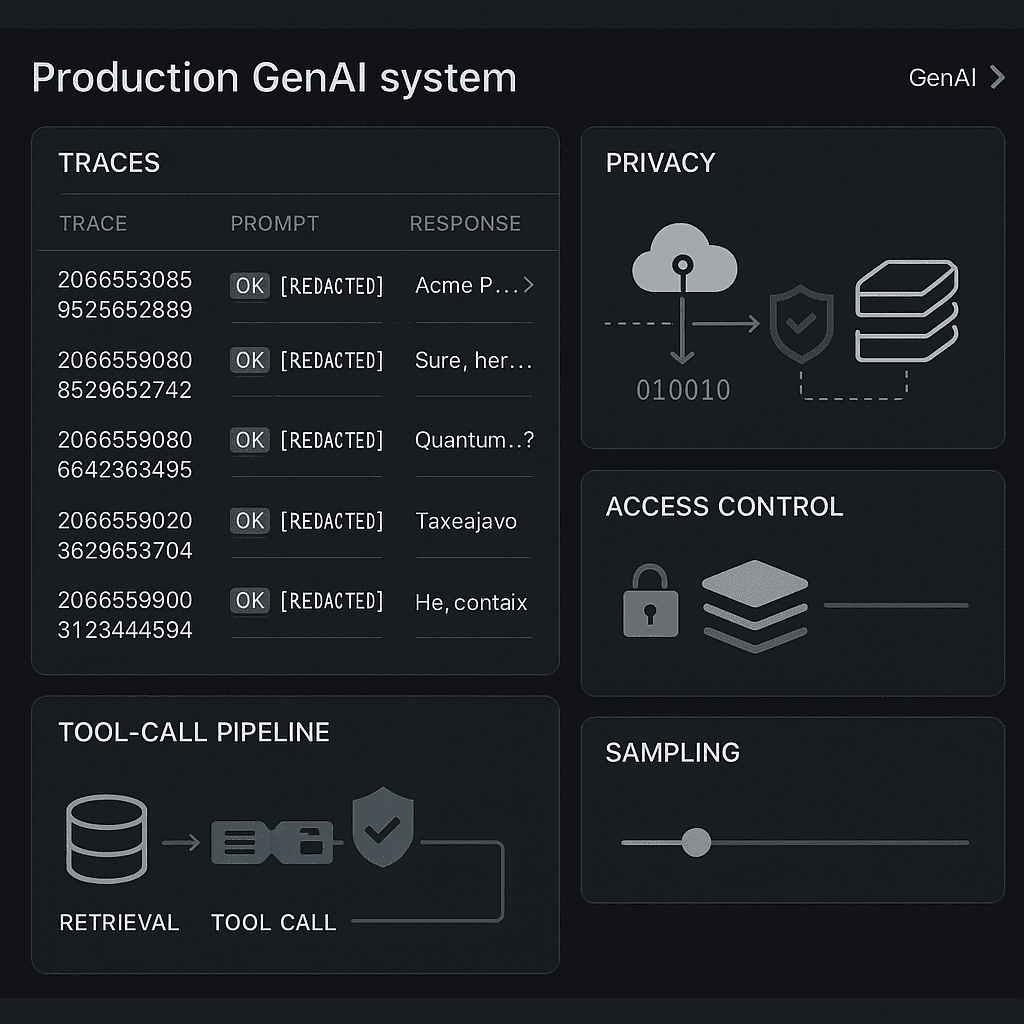
The production challenge is not just “remove PII.” It is to preserve enough signal for debugging, quality analysis, cost attribution, and model improvement while making sure logs do not become a shadow data lake of regulated information.
That means architecting observability as a first-class privacy system.
The pattern I recommend is simple to describe but nuanced to implement:
- Treat traces as products with explicit data contracts, not as arbitrary dumps.
- Separate operational observability from privileged replay datasets.
- Apply transformation at field boundaries, not just after serialization.
- Design for layered privacy controls: minimization, redaction, tokenization, sampling, retention, and access.
- Evaluate privacy controls the same way you evaluate model quality: with representative tasks, measurable regressions, and incident drills.
Done well, you can keep the logs useful. Done poorly, you either leak data or make incident response impossible.
The failure mode: “log everything now, fix it later”
A very common architecture for early-stage GenAI products looks like this:
- API receives user request
- Request body is passed to an orchestrator
- Orchestrator calls retriever, reranker, prompt builder, LLM, and tools
- Middleware emits traces to an APM vendor or analytics warehouse
- Engineers inspect raw prompt/response pairs when debugging
On paper, this seems fine. In practice, three things happen.
First, the most useful logs for debugging are also the most dangerous. Full prompts contain names, emails, account IDs, legal details, health data, trade secrets, source code, or internal URLs. Retrieved chunks often contain more sensitive text than the user prompt. Tool outputs can include entire customer records.
Second, logging paths multiply. The API layer may redact one field, while the tracing SDK captures the pre-redacted request object. The retriever may suppress the raw chunk text in application logs, while an exception reporter captures the full query context. The LLM client may be configured not to store provider-side prompts, but your own telemetry pipeline still stores them in full.
Third, teams conflate different observability use cases:
- Real-time debugging
- Incident response
- Offline quality analysis
- Product analytics
- Cost and latency optimization
- Fine-tuning or prompt improvement datasets
- Security investigations
Each of these use cases needs different data, different retention, and different access. If you use one giant raw trace stream for all of them, you will either overexpose sensitive data or over-redact until nobody trusts the telemetry.
The naive answer is usually “we’ll just run regex redaction over the final JSON blob.” That helps a little, but it fails in predictable ways.
Why the naive approach fails
1. Blob-level redaction misses context and structure
Once everything is serialized into an arbitrary JSON or string payload, you’ve lost important semantics:
- Was this value a user email or an internal service account?
- Was this text shown to the model or only used for ranking?
- Did this value come from retrieval, a tool, or a system prompt?
- Is the field safe to hash, safe to drop, or needed for cardinality analysis?
Field-level decisions become much harder after the data is flattened.
2. Regex-only redaction is fragile
Regexes catch easy cases like US phone numbers or credit-card-like patterns. They miss:
- Names and addresses in natural language
- IDs with tenant-specific formats
- PII embedded in PDFs or OCR text
- Sensitive free-text descriptions without explicit identifiers
- Multi-lingual variants
- Retrieval chunks where the risky content is domain-specific rather than syntactically obvious
Worse, regexes can over-redact operationally important values like error codes, SKUs, or document IDs.
3. Full deletion kills debugging
Teams often swing from over-logging to “store almost nothing.” Then incidents become extremely expensive to diagnose. You can’t answer:
- Did the prompt template regress or did retrieval fail?
- Was the model non-deterministic, rate-limited, or context-starved?
- Which tool call blew up, with what argument shape?
- Why did tenant A see latency spikes but tenant B didn’t?
If you remove too much context, engineers create backchannels: ad hoc local logs, screenshots, manual reproductions with copied customer data. Those are often less secure than a well-designed logging system.
4. One-way redaction breaks root-cause analysis for a subset of incidents
Irreversible masking is often correct, but not always sufficient. Some incidents require correlating a bad output with a specific record, document, or user session under strict access control. If every identifier has been completely removed, your only option is to reproduce directly against production systems, which is slower and riskier.
5. Sampling without tenant or risk awareness creates blind spots
If you sample traces uniformly, you can under-sample:
- High-value enterprise tenants
- Rare failure modes
- New model rollouts
- Tool error paths
- High-risk data flows like OCR or file ingestion
Conversely, you may over-sample the noisiest users and collect more sensitive data than necessary.
6. Retrieval systems multiply privacy surface area
RAG introduces a major observability trap: the most useful explanation for a bad answer is often “which chunks were retrieved and why?” But raw chunks are frequently copied from systems with much stronger access controls than your telemetry backend. Observability becomes an exfiltration path if you log chunk text casually.
7. Agent/tool traces are often the largest leak vector
In agentic systems, the model may call internal tools with arguments and receive expansive results. The tool output, not the user prompt, is often the most sensitive object in the trace. Logging full tool I/O by default is one of the fastest ways to recreate your production database inside your observability platform.
The better pattern: observability by trace class, field policy, and replay tier
Instead of one raw trace stream, design three layers:
Layer 1: Operational traces
Purpose: live debugging, SLO monitoring, cost/latency analysis, rollout comparisons.
Properties:
- Strictly minimized
- Mostly irreversible transforms
- Short retention
- Broad but controlled engineering access
- Structured fields over raw blobs
Layer 2: Privileged replay artifacts
Purpose: deep incident response, reproducibility, model quality investigation, secure prompt replay.
Properties:
- Narrowly scoped
- Strong encryption and access controls
- Small sample volume
- Explicit approval or break-glass access
- Can include reversibly protected data where justified
Layer 3: Curated evaluation/improvement datasets
Purpose: offline evals, regression analysis, prompt/model improvement, human review.
Properties:
- Deliberately selected examples
- De-identified where possible
- Separate governance from telemetry
- Labeled and versioned
- Longer retention, but only after curation
This separation matters. Most teams try to make one data stream serve all three layers. Don’t. Real-time ops data and replay-grade data have very different privacy and access requirements.
Core architecture
A production-safe architecture typically looks like this:
textUser/API
  -> Request classifier (tenant, route, risk tier)
  -> Orchestrator
      -> Prompt builder
      -> Retriever / reranker
      -> Tools / external APIs
      -> LLM client
  -> Trace event emitter
      -> Field-aware privacy transformer
          -> Redaction / tokenization / dropping
          -> Policy by field, tenant, route, environment
      -> Trace router
          -> Operational observability store
          -> Privileged replay vault
          -> Evaluation curation queue
Key design choice: the privacy transformer runs before data reaches any general-purpose logging sink.
Do not rely on downstream dashboards, warehouses, or SIEM pipelines to “clean it up later.” By then, too many copies may already exist.
Design the trace schema first
The most practical thing you can do is define a typed trace schema and force every component to emit structured events against it.
For a GenAI request, I usually want these event categories:
request_metaprompt_assemblyretrieval_summarytool_invocationmodel_callresponse_summarysafety_decisionerror_eventcost_usagehuman_feedback
Each category gets explicit fields with sensitivity classes.
Example for model_call:
trace_id: low sensitivitytenant_id_token: tokenizedroute_name: low sensitivitymodel_name: low sensitivityprovider: low sensitivityinput_char_count: low sensitivityoutput_char_count: low sensitivityinput_token_count_est: low sensitivitylatency_ms: low sensitivityprompt_template_version: low sensitivitysystem_prompt_fingerprint: irreversible hashuser_prompt_redacted: high sensitivity but transformedretrieval_context_summary: transformedtool_context_summary: transformedfinish_reason: low sensitivitysafety_flags: medium sensitivityexception_class: low sensitivity
The schema forces you to decide what is actually needed. Most debugging workflows don’t need raw values; they need shape, counts, versions, fingerprints, categories, and a small amount of controlled content.
Classify fields by transformation policy
A useful policy matrix looks like this:
Class A: Safe metadata
Examples:
- model name
- region
- latency
- token counts
- prompt template version
- status code
- retry count
Action:
- Store as-is in operational traces
Class B: Correlatable identifiers
Examples:
- tenant ID
- user ID
- document ID
- conversation ID
- tool resource ID
Action:
- Replace with deterministic tokens or keyed hashes
- Keep reversibility only in a separate secure mapping service if truly needed
This preserves grouping and cardinality without exposing raw IDs.
Class C: Sensitive free text with debugging value
Examples:
- user prompt body
- assistant response body
- retrieved chunk excerpts
- tool request arguments
- tool result summaries
Action:
- Apply field-aware redaction, summarization, truncation, or extraction to reduced forms
- Store redacted or minimized derivative in operational traces
- Route raw or less-transformed form only to privileged replay when justified
Class D: High-risk secrets or regulated payloads
Examples:
- access tokens
- passwords
- session cookies
- raw medical records
- payment data
- full source documents from sensitive systems
Action:
- Never store in general traces
- Prefer drop at source
- If absolutely required for a break-glass workflow, encrypt separately with narrow retention and explicit access workflow
This is the governance backbone. Without it, teams argue case by case and inevitably drift.
Redaction strategy for prompts and responses
Prompt and response logging is where the tradeoff feels most painful because these fields are genuinely useful.
The right answer is usually not “store the whole text” or “store nothing.” It is to store transformed derivatives designed for specific debugging tasks.
Useful derivatives include:
- Entity-redacted text
- Length and token statistics
- Language detection
- Content category labels
- Prompt template version and variable presence map
- Semantic fingerprint or embedding hash for clustering similar failures
- Error-focused snippets around failure markers
- Structured extraction of known slots
For example, instead of storing:
“Please summarize Jane Doe’s cardiology visit on 2024-08-15. MRN 123456…”
You might store:
“Please summarize [PERSON]’s [MEDICAL_VISIT] on [DATE]. [PATIENT_ID] …”
plus:
- original char length
- entity counts by type
- route = visit-summary
- prompt template version
- redaction confidence
- classifier risk score
That preserves enough for many workflows:
- Was the route correct?
- Was the prompt too long?
- Did PHI-heavy inputs correlate with lower quality?
- Did a specific template version regress?
For responses, store:
- redacted response text if needed
- refusal/safety categories
- citations present/missing
- JSON schema validity
- hallucination heuristic flags
- toxicity or policy scores
- output length and stop reason
This gives product and engineering teams useful telemetry without retaining raw customer prose in the common case.
Field-level tokenization versus irreversible hashing
Teams often ask whether to tokenize IDs or just hash them. The answer depends on the job.
Irreversible keyed hash
Best when you need:
- correlation across events
- grouping by tenant/user/document
- low operational complexity
- no need to reconstruct the original value from the log pipeline
Pros:
- simpler and safer
- avoids maintaining detokenization access paths
Cons:
- impossible to reverse during incident response
- salt/key rotation can complicate long-term comparisons
Reversible tokenization
Best when you need:
- approved re-identification for incident handling
- join-back to source records under controlled workflow
- support escalations tied to a concrete resource
Pros:
- operationally powerful
- enables secure replay and precise record lookup
Cons:
- much higher security burden
- mapping store becomes critical infrastructure
- access workflows must be excellent
My bias: use irreversible keyed hashing for most identifiers in operational traces. Add reversible tokenization only for a short list of identifiers where you can defend the need in an incident runbook.
A common compromise is split-token architecture:
- Operations store sees deterministic token only
- Secure token vault stores token-to-raw mapping
- Access to vault requires break-glass approval, audit trail, and short-lived credentials
Retrieval payload scrubbing for RAG
RAG observability needs special treatment because raw retrieved chunks are often the most sensitive artifact in the system.
For operational traces, log retrieval as summaries, not payloads.
Recommended fields:
- query fingerprint
- query redacted form
- top-k document tokens
- source system label
- ACL evaluation result
- similarity score stats
- reranker score stats
- chunk lengths
- citation inclusion flags
- retrieval freshness metadata
- retrieval failure reason
If you need content-level debugging, store one of these reduced forms:
- first N redacted tokens of each chunk
- sentence-level snippets around matched terms after entity masking
- document title/category with raw body omitted
- generated chunk summary produced by a scrubbing model or rules
What you usually should not log broadly:
- full chunk text
- full document body
- arbitrary file extracts
- OCR output in the clear
For replay workflows, I prefer storing document references plus a version/fingerprint rather than copying content into telemetry. During approved investigation, the system can fetch the source document again from its system of record using current access controls. This reduces data duplication, though you need to account for document drift and deletions.
Tool trace minimization for agents
If you’re building agents, define logging policy per tool contract.
Every tool should specify:
- safe-to-log input fields
- safe-to-log output fields
- fields to hash/tokenize
- fields to summarize only
- fields to drop entirely
- max byte budget for telemetry
For example, a CRM lookup tool might allow logging:
- customer_token
- record_type
- field_count_returned
- latency
- success/failure
but not:
- full notes text
- email addresses
- phone numbers
- billing details
Instead of logging raw tool output, generate a compact execution summary:
json{
  "tool_name": "crm_lookup",
  "resource_token": "tok_93ab...",
  "requested_fields": ["account_status", "plan_tier", "last_ticket_date"],
  "returned_field_count": 12,
  "sensitive_field_count": 5,
  "latency_ms": 184,
  "result_shape": "object",
  "error": null
}
This is enough for most debugging. If the problem was “the model got too much irrelevant tool context,” you can also log field categories, length, and truncation decisions rather than the values themselves.
Also: never log hidden reasoning traces or chain-of-thought-like internal deliberation unless you have a compelling and reviewed reason. Operationally, they rarely add as much value as people imagine, and they massively increase privacy and policy risk.
Tenant-aware and risk-aware sampling
Sampling policy should reflect business risk, privacy risk, and debugging value.
A better sampling strategy combines:
- baseline low-rate sampling for successful low-risk traffic
- elevated sampling for errors, timeouts, validation failures, and policy blocks
- temporary rollout sampling for new models, prompts, or retrieval configs
- tenant-specific overrides for strategic accounts
- reduced or zero-content sampling for high-risk routes
Example policy:
- Success path, low-risk route: 1% operational trace with transformed content only
- Error path: 50% operational trace, plus 5% replay-candidate capture
- New prompt version rollout: 10% for affected route for 24 hours
- PHI-heavy route: 0% raw content, only summaries unless incident flag enabled
- Strategic tenant with contractual restrictions: metadata-only unless explicit opt-in
Sampling should happen after classification but before any privileged routing. And sampling decisions themselves should be logged so analysts understand coverage.
One subtlety: content sensitivity and product criticality are not the same thing. A route may be high-value for quality analysis but too sensitive for broad logging. That’s exactly when you need a curated replay path instead of increasing raw observability volume.
Secure replay datasets without creating a second shadow database
At some point, you will need a reproducible dataset for incident analysis or model improvement. The mistake is building this by quietly retaining full raw traces forever.
A better pattern:
- Start from operational traces to identify candidate sessions.
- Pull corresponding raw artifacts from systems of record only when justified.
- Rehydrate into a secure replay workspace.
- Apply additional de-identification or reviewer-specific filtering.
- Retain only as long as the replay or evaluation purpose requires.
In other words, make replay an explicit workflow, not a side effect of logging.
Secure replay workspace controls should include:
- isolated storage account or bucket
- customer/tenant scoping
- envelope encryption with separate key hierarchy
- just-in-time access grants
- full audit logs of every access and export
- no copy/paste or export where feasible
- expiration/TTL on datasets
- reviewer watermarking for screenshots and downloads
For model improvement, create curated examples rather than passing through raw traces wholesale. Human reviewers can often label de-identified inputs just fine if your redaction is good enough.
Access controls matter as much as transformation
A common mistake is thinking redaction alone solves the problem. It doesn’t.
You need defense in depth:
- role-based access control for dashboards and trace search
- row/tenant-level access restrictions
- field-level restrictions for sensitive transformed fields
- separate roles for ops, support, ML, and security teams
- break-glass workflow for replay vault access
- immutable audit trail
- retention enforcement and deletion workflows
In practice, most engineers do not need broad access to anything beyond operational traces. ML researchers may need curated datasets but not production tenant metadata. Support may need tenant-scoped visibility but not global search. Security may need broader metadata visibility but not model improvement artifacts.
The biggest gains often come from reducing who can query free text at all.
Implementation details that make or break the design
1. Transform before serialization and before third-party SDKs
Instrument your code so privacy transformation occurs on structured event objects before they are handed to any logger, tracer, error reporter, or analytics SDK.
If you redact only in one sink, another sink will leak the original object.
2. Use policy-as-code for field handling
Store policies centrally, version them, and test them. Example dimensions:
- event type
- field path
- environment
- tenant tier
- route
- data residency region
- incident mode
Example actions:
- allow
- drop
- truncate
- redact_entities
- hash_deterministic
- tokenize_reversible
- summarize
- route_to_replay_only
This makes behavior explainable and reviewable.
3. Set byte budgets per trace segment
Large traces are both expensive and risky. Put hard caps on:
- prompt excerpt length
- number of retrieval items logged
- tool output summary size
- total trace size per request
When truncation happens, log that it happened.
4. Log provenance for every text field
Any text derivative should carry provenance metadata:
- source = user_prompt | retrieval | tool_output | system_prompt | prior_turn
- transform = redacted | summarized | hashed | dropped | truncated
- transform_version
- confidence score if ML redaction used
Without provenance, debugging is harder and audits are weaker.
5. Separate privacy filters from model prompts
Do not let the same prompt used for your application also decide what is safe to log. Privacy transformation should be deterministic or governed independently, otherwise app-model behavior changes can affect your compliance posture.
If you use an LLM-assisted scrubber, pair it with guardrails, schemas, confidence thresholds, and fallback policies.
6. Build deletion and retention as product features
You need documented TTLs for:
- operational traces
- replay artifacts
- curated evaluation datasets
- tokenization mappings
And you need deletion by tenant, by user, and by trace lineage where contractually or legally required.
Model and tool choices for scrubbing
There is no single best mechanism. In practice, use a layered stack.
Rules and regexes
Best for:
- obvious structured identifiers
- secrets and tokens
- well-known jurisdictional formats
Pros:
- fast
- cheap
- deterministic
Cons:
- poor recall on free text
Traditional NER or domain-specific detectors
Best for:
- names, locations, dates, patient IDs, legal references
- domain-specific entities with training support
Pros:
- lower cost than LLMs
- can be run inline
Cons:
- mixed recall/precision across domains and languages
LLM-based scrubbers
Best for:
- messy unstructured text
- domain-specific confidential content categories
- generating useful redacted summaries rather than simple masks
Pros:
- flexible
- handles context well
Cons:
- cost, latency, and non-determinism
- may themselves process sensitive content, so deployment choice matters
A common production setup:
- Inline fast rules for secrets and high-confidence patterns
- Inline lightweight NER for common entity classes
- Optional asynchronous LLM scrubber for selected samples or replay curation
- Manual review queue for high-value datasets
Cost/latency tradeoff matters. You usually cannot afford a heavy LLM scrubber synchronously on every request in a low-latency product path. But you also don’t need to. Operational traces can rely on rules + NER + minimization, while replay curation uses slower and stronger processing offline.
Evaluating whether privacy protections broke debugability
This is the part teams skip, and it’s where the real engineering discipline shows.
Do not assume your redacted logs remain useful. Test it.
Build an eval suite around actual observability tasks.
Task family 1: Incident root-cause analysis
Create representative incidents such as:
- retrieval returned irrelevant documents
- prompt template variable missing
- tool schema mismatch
- provider timeout/retry storm
- unsafe output escaped a guardrail
- tenant-specific degradation after model switch
For each incident, ask an engineer to diagnose using only operational traces. Measure:
- success rate of correct diagnosis
- time to diagnosis
- number of times replay access was required
- false leads caused by over-redaction
If diagnosis quality collapses, you removed too much or the wrong information.
Task family 2: Quality analysis
Can PM/ML teams still answer:
- which prompt version regressed?
- which route has highest hallucination rate?
- which retrieval source causes low citation quality?
- which tenants see the most schema-invalid JSON outputs?
Measure whether transformed traces preserve enough signal for aggregate analysis.
Task family 3: Security and privacy recall
Seed datasets with realistic sensitive content and verify:
- detection recall by entity/content type
- precision to avoid useless over-redaction
- leakage rate into each sink
- differences by language, OCR quality, and input source
The key metric is not just redaction accuracy; it is sink-level residual leakage risk.
Task family 4: Replay usefulness
For the subset routed to privileged replay, test:
- can investigators reproduce the failure?
- can they correlate with source records safely?
- is access workflow fast enough during a sev-1?
- are replay datasets deleted on schedule?
Task family 5: Cost and latency regression
Privacy controls add overhead. Measure:
- p50/p95 latency added by inline transforms
- infra cost per million requests
- storage savings from minimization
- replay curation cost per sampled session
These numbers matter because the logging design has to survive contact with volume.
Concrete metrics to track
A mature dashboard for this system should include:
- percent of traces with raw free text stored in operational sink
- percent of events dropped/truncated by policy
- redaction recall on seeded canaries
- false-positive redaction rate on known-safe fields
- average trace size before/after transform
- fraction of incidents diagnosable from operational traces only
- median replay approval time
- replay artifact TTL compliance
- top sources of residual sensitive content leakage
- per-tenant sampling coverage
If you don’t measure these, the system will drift.
Cost and latency tradeoffs in practice
There is no free lunch here.
More aggressive inline redaction increases CPU and tail latency. Richer summaries improve debugging but cost storage. Reversible tokenization improves incident handling but adds operational burden and security risk. Reduced logging lowers exposure but can increase mean time to resolution.
Some practical heuristics:
- Start with metadata-rich, content-light operational traces.
- Prefer deterministic transforms in the request path.
- Push expensive semantic scrubbing and curation to async workflows.
- Store references and fingerprints instead of payload copies whenever possible.
- Reserve reversible access for narrow break-glass scenarios.
- Tune by route, not globally; customer-support chat, code assistant, and medical summarization have very different risk profiles.
For many teams, the best ROI move is not a perfect PII detector. It is replacing raw text logging with structured summaries, version tags, and deterministic fingerprints. That alone removes a huge amount of risk while preserving most operational value.
A practical rollout plan
If you already have risky logs in production, do not wait for a grand redesign before making improvements.
Phase 1: stop the bleeding
- inventory every sink where prompts, responses, retrieval chunks, and tool payloads may land
- disable raw payload logging in the highest-risk paths
- add secret/token filters immediately
- restrict free-text query access
- shorten retention on existing raw logs where possible
Phase 2: define schemas and policies
- create event types and field classes
- implement privacy transformer before all sinks
- tokenize/hash identifiers
- move to summaries for retrieval and tool traces
Phase 3: build replay path
- secure vault or isolated workspace
- break-glass workflow and audit logging
- selective sampling rules for replay candidates
Phase 4: evaluate and tune
- run incident drills
- benchmark latency/cost
- measure residual leakage
- adjust route-specific policies
Phase 5: operationalize governance
- policy reviews for new routes/tools
- automated tests in CI for log outputs
- retention/deletion automation
- periodic access reviews
What “good” looks like
A good production design has these properties:
- Engineers can diagnose most incidents from operational traces without seeing raw customer content.
- Sensitive identifiers are correlatable but not plainly exposed.
- Retrieval and tool traces explain behavior through summaries and provenance, not copied payloads.
- Replay of raw or semi-raw artifacts exists, but only through narrow, audited workflows.
- Sampling is aligned with risk, tenant obligations, and debugging needs.
- Privacy controls are tested against real observability tasks, not just compliance checklists.
That last point is the most important. A logging system that is “private” but unusable will be bypassed. A logging system that is “useful” but unsafe will eventually trigger an incident. The job is to engineer the middle path deliberately.
For GenAI systems, observability is no longer just an SRE concern or just a security concern. It is a data-governance layer sitting in the core execution path of your product. Treat it that way.
If you do, you can keep enough fidelity to debug prompts, retrieval, tools, and model behavior — without quietly turning your tracing platform into the most dangerous database you operate.